
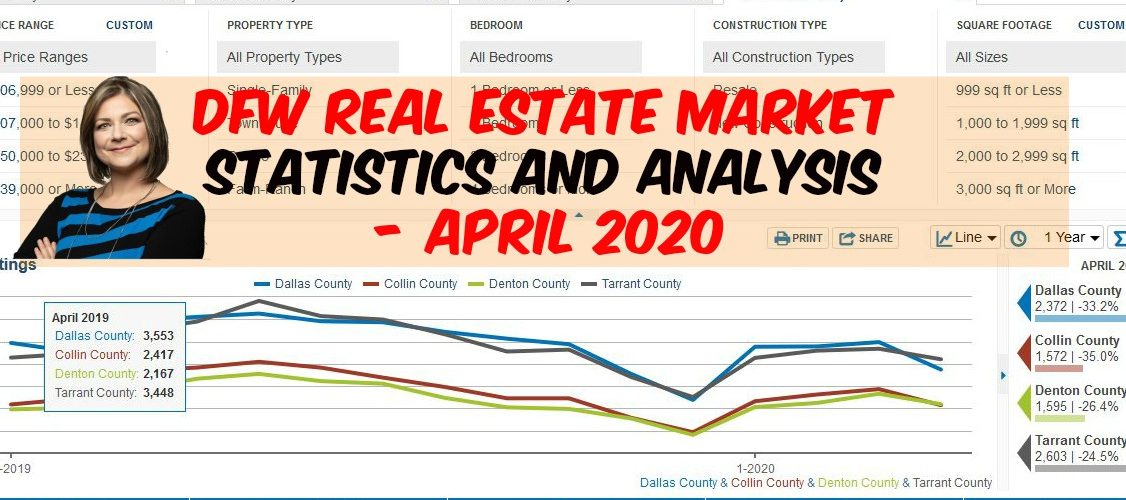
DFW April 2020 Real Estate Update
May 12, 2020
Dallas – Collin – Tarrant – Denton counties of North Texas

Good morning, North Texas! It is the 2nd week of May 2020, we are STILL in the midst of the COVID-19 epidemic, and although the shelter-at-home restrictions are slowly being lifted, the number of people who perished from COVID continues to go up every day. The number of unemployment claims went up dramatically during April. However, as the state starts to slowly reopen, the regional economic woes may slowly start to ease up.
In the meantime, what has been happening in the DFW real estate market since March? Numbers don’t lie, so if you are feeling particularly nerdy today, let’s take a look at the numbers.
Below are the North Texas MLS statistics as of the end of April 2020.
The average number of new listings in DFW – April 2020
Comparing statistics for April 2019 – April 2020
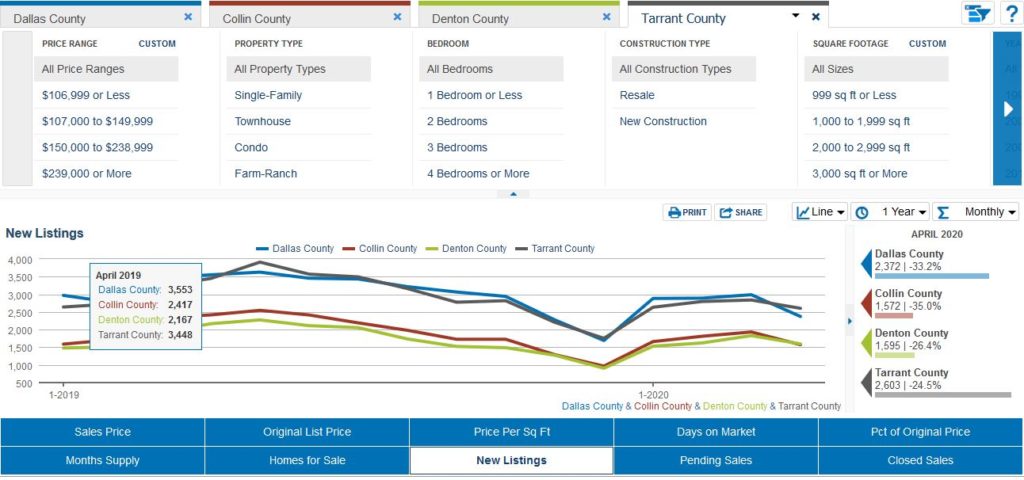
The number of homes posted by real estate agents for sale in Dallas, Collin, Denton, Tarrant counties dropped by approximately 30% overall compared to the same month in 2019. However, about 8 thousand sellers were bullish (or desperate) enough to list their properties for sale.
Note: most of these new listings were posted in the last week of April, right after the shelter-at home orders were lifted.
Collin county posted the largest year-to-year drop in new listings. Dallas County was a close second. The county with the smallest decline in new listings was Tarrant county, which experienced a 24.5% decline compared to 2019.
I will make a more in-depth review of the new listings statistics by price category later, but the overall takeaway is that so far 30% fewer sellers decided to put their houses on the market in April of 2020 than the previous year, shrinking the number of available choices for the prospective buyers.
The average number of closed sales in DFW – April 2020
Comparing statistics for April 2019 – April 2020
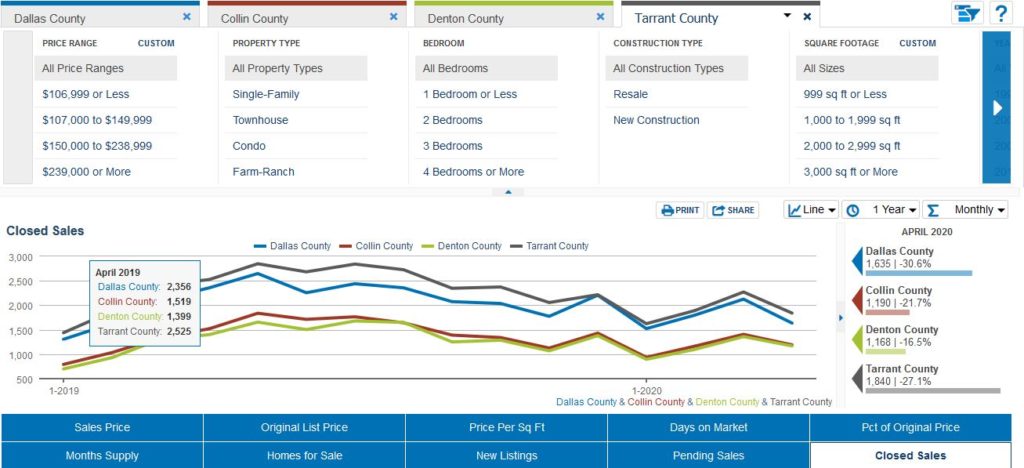
The downward trend for closed sales mimicked the numbers of the new listings. Overall across all four counties, the number of closed sales dropped 24% compared to the same month a year ago. Nevertheless, approximately 5833 buyers were able to close their transactions in one month in these four counties
Dallas and Tarrant counties experienced the largest declines in new listings AND closed transactions. Collin and Denton counties fared much better by comparison.
The average house Days On Market (DOM) in DFW- April 2020
Comparing statistics for April 2019 – April 2020
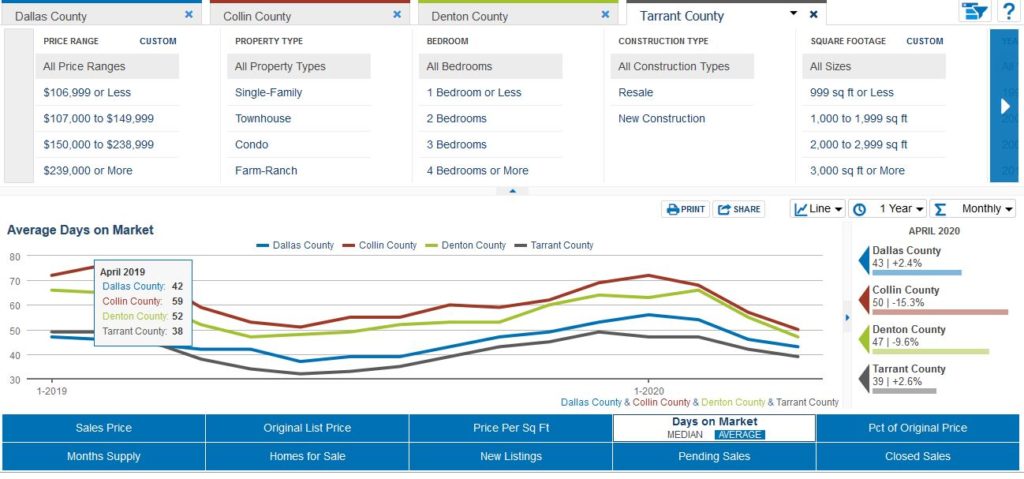
Alot of experts (myself included) were worried about houses not being able to sell due to buyers pulling out because of failed financing and change in employment security. However, so far, these concerns are not materializing just yet. The average DOM for houses in all four counties April was was 45 days in April of 2020, compared to 48 days the same month last year – a surprising decrease.
With that said, DOM increased by 1 day for Dallas and Tarrant counties, but decreased by 10% and 15% respectively for Denton and Collin counties.
I will make a more in-depth review of the DOM results by price category later, but the overall takeaway is that so far is that the buyers are closing on properties faster than in April of last year. This may be an inadvertent consequence of fewer houses competing with one another, or possibly the buyers rushing to close to secure the financing.
Average sold homes prices in DFW – April 2020
Comparing statistics for April 2019 – April 2020
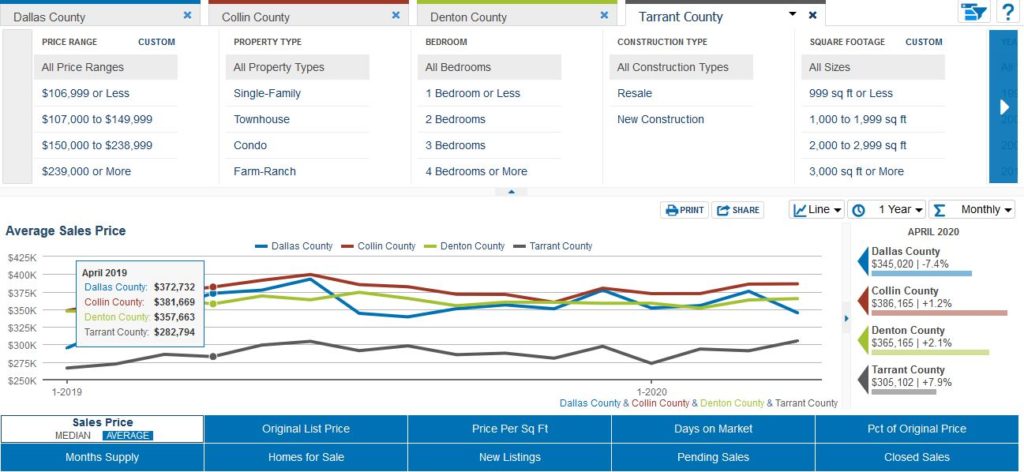
Prices of “solds” or “homes sold” are one of the most accurate indicators of the buyers’s current view of the health of the market. In April 2020, the average homes sold prices across the four counties went up by an average of $1600, or a 0.05% increase from last year. However, Dallas county saw a price drop of approximately 7%.
This potentially indicates that, overall, Dallas county was hit harder economically than the surrounding counties, and the sellers were forced to lower their prices. However, Collin, Denton, and especially Tarrant counties saw slight solds price increases, perhaps demonstrating that the buyers in those counties had fewer reasons to believe that the economic changes would affect their home values going forward.
Overall, it appears that buyers are still optimistic about the housing market and are buying at slightly higher prices than at the same time last year in most DFW areas except Dallas county.
Final Sold Price v Listing Price Ratios in DFW – April 2020
Comparing statistics for April 2019 – April 2020
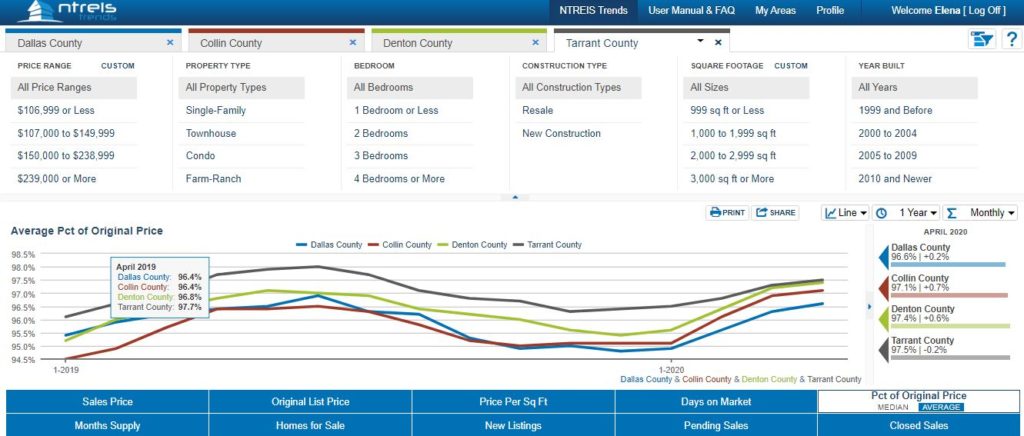
But if the prices rose slightly and the days on market went down, then maybe the buyers were getting killer deals on their purchases? It does not appear to be so.
The final sales prices in April 2020 were within 96%-97% of the initial asking price. That is pretty much unchanged from April 2019. In fact, it looks like the ratio went up slightly, creating a more favorable outcome for the sellers.
The buyers in Dallas county were willing to offer 0.2% closer to the asking price than last year. The buyers in Collin and Denton county were offering 0.7% and 0.6% closer to the asking price than in 2019. Tarrant county buyers were the only ones who got a lower sales price to asking price ratio – but only by 0.2%.
Therefore it does not appear that COVID had an overall negative effect on the sales to asking price ratio. That is the opposite of what most experts expected, and is great news for the sellers!
*Percentage found when dividing a listing’s sales price by its original list price, then taking the average or median for all sold listings in a given month, not accounting for seller concessions
CONCLUSION
Other than the number of properties offered for sale, the rest of the market indicators are very comparable to the 2019 levels.
Prices, sold to listing price ratio, and days on market show a slight improvement from a year ago. Dallas County housing market appears to be affected by the economic slowdown more than other nearby counties.
All data was provided by NTREIS, the North Texas MLS, and all graphs are theirs.
- 72SOLD Home Selling Program
- All Videos
- Buyer Resources
- Changes in the Real Estate Industry
- Educational Videos for Buyers
- Educational Videos for Home Investors
- Educational Videos for Home Sellers
- Events
- Financial Fitness
- For foreign buyers and investors
- For out of state buyers and investors
- Holidays & Seasons
- Home Buyers Important Market Updates
- Home Investor Resources
- Home Loan Financing Assistance
- Home Market Reports for Home Sellers
- Home Purchase Contracts and Forms
- Home Seller Tips and Tricks
- Homeowner Resources
- Houses
- Investor Tips and Tricks
- ITIN Loans
- Materials and publications
- Moving to North Texas?
- Need to Save on Your Mortgage?
- New Construction Homes in DFW – News and Updates
- Rent -To-Own Programs in Texas
- Renter Resources
- Seller Financed Homes in N. Texas
- Seller Resources
- Selling Your Home for CASH
- Stats and Trends
- Uncategorized
- The North Texas Homebuyer Decision System
- Contract to Close: From Start of Underwriting to Closing
- The First Step in Rent-to-Own (That Most Buyers Avoid)
- How the Right Agent Can Turn Foggy Windows Into $70,000+ in Buyer Value
- I Have No Credit—Can I Still Do Rent-to-Own?