
MAY 2023 – DFW HOME MARKET UPDATE
June 11, 2023
June 10, 2023 – by Elena Garrett, Realtor, and 72Sold Area Director
We continue to observe as the trends in the DFW housing market are starting to recover from the shocks of last year’s market changes. Let’s look at the details.
Check out below the trends that the home market data is showing for the 4 main counties in the DFW area: Dallas County, Collin County, Tarrant County, and Denton County.
ELENA’S PREDICTIONS FOR THE NEXT 4-6 MONTHS:
Despite the unprecedented jumps in the lending interest rates, it is now clear that the sale trends in 2023 are repeating the traditional “Spring-Summer” price fluctuation of the previous years. The best times to sell at the highest profit is now June and July. The prices are likely to follow the “school out, school in” schedule and will continue to remain high until mid-July and August. The prices are likely to start decreasing again closer to August-September.
RECOMMENDATIONS:
Home sellers who are trying to sell this summer are advised to keep in mind that higher interest rates mean that the shoppers are currently in the bargain-hunting mood. If your home needs repairs and updates, you can attract bargain-shopping buyers by offering incentives such as interest-rate buydowns and cash concessions. If at all possible, I would recommend that home sellers who are looking to get the highest amount for their property to consider timing the market and selling in June and July at the latest, and use a program like 72Sold to make sure that their home sells within the first 2-3 days of being on the market. Homes that are not sold within the first week are more likely to be targeted by bargain shoppers who will expect the sellers to provide cash concessions to the buyers.
Home buyers who are trying to buy in June-July will be buying at the peak of the seasonal price increase, unfortunately. As the interest rates remain close to 7%APR, it is strongly recommended that home buyers who plan to use a loan to buy their home made asked their lender for ways to buy down the interest rates, temporarily or permanently. For home buyers on a tight budget, consider looking at homes that have been on the market for over 60 days, as those homes are more likely to provide price concessions or funds to help the buyers with the interest rate buydowns.
To the home sellers: we recommend seriously looking into the 72Sold home selling program which is designed to sell nearly any home within the first 72 hours of it being on the market – and, typically, at a higher price than competing homes. With the 72Sold approach, at the very least the home sellers will get the best chance to sell their homes at the top of today’s market and without having to do any price cuts or concessions.
DFW STATISTICS FOR MAY 2023
Home Prices Are Still In the Midst of Summer Surge
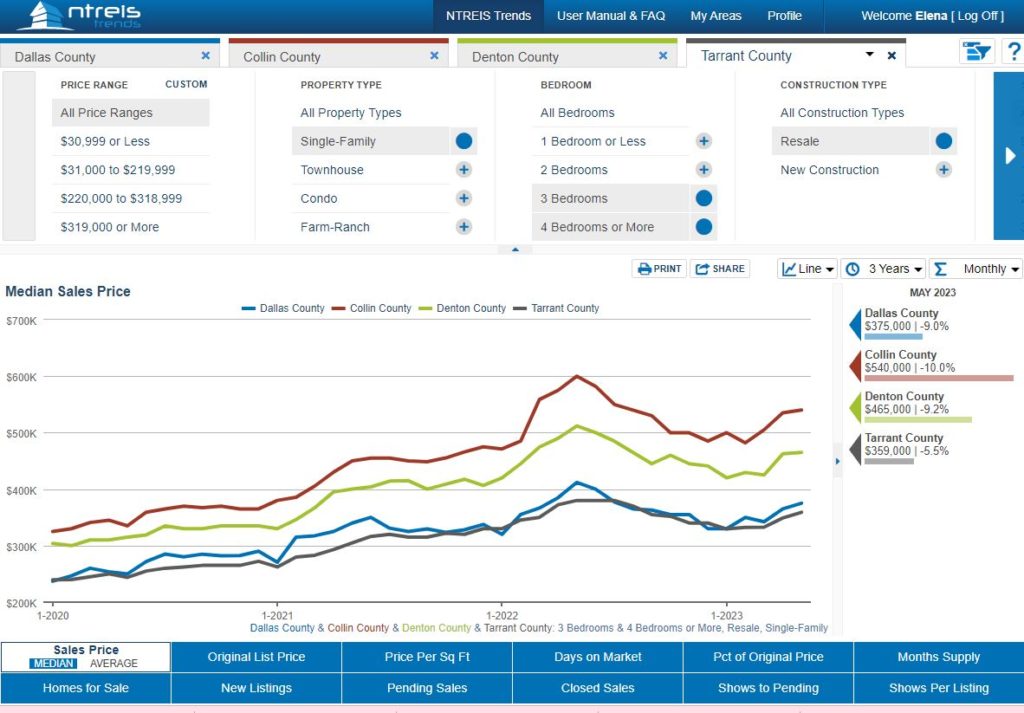
Home prices in the DFW area have suffered a decline since May 2022, but are now on the strong growth path again.
As it happens every year, Spring and Summer are the time when more and more buyers search for a new home, “heating up” the home prices in the process. In Collin County, the average home price increased by over $40,000 since January 2023, In Dallas county, the median prices went up by $45,000 since January. In Tarrant County, home prices went up on average by $65,000 since January. In Denton County – the median price increased by $45,000 on average.
This seasonal trend is similar to the market behavior in the past few years, despite the interest rates being 2X higher than they have been in a long tine. This brings a conclusion that, from the standpoint of home market behavior, the market seems to follow the normal seasonal trends, although the overall prices in all counties are still lower than they were at their peak in May of 2022.
Compared to May of 2022, the average home in Collin county in May of his year is being sold at $40,000 less, for example. In Dallas county, the homes are being sold for $37,000 cheaper; in Tarrant county – $21,000 cheaper, and in Denton county – $47,000 cheaper than in May 2022. That means that Denton county has the most difficult time recovering its prior prices, followed by Collin county and Dallas county. In comparison, Tarrant county has recovered the fastest.
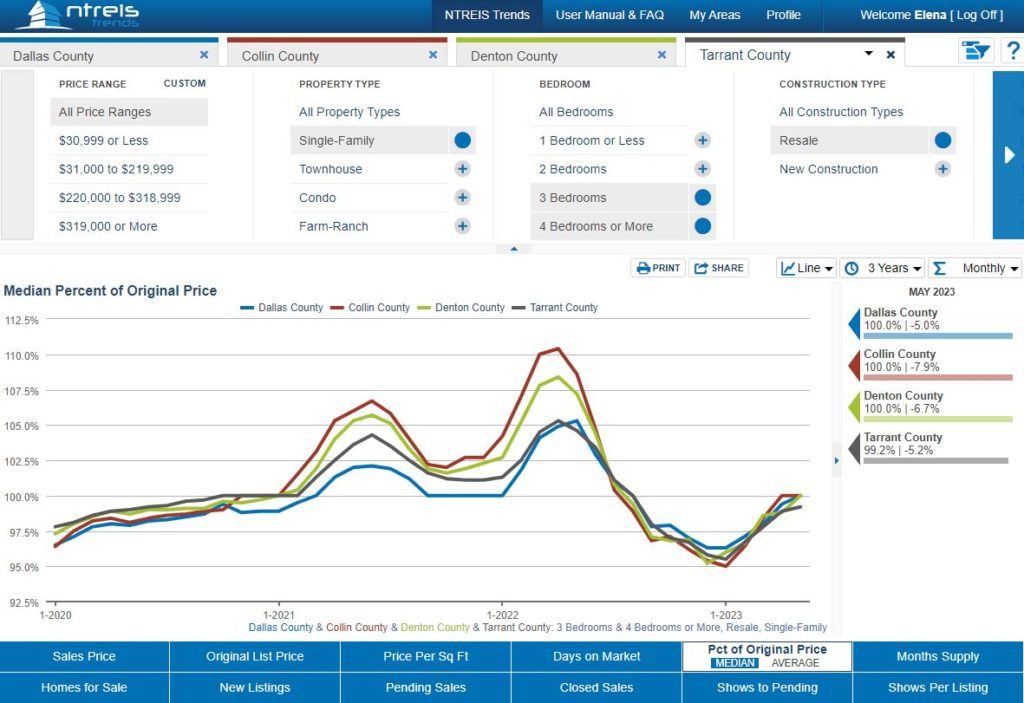
Bidding Wars Are Rare This Year
The graph below shows you how much in terms of percent of the asking price the house sold for. For example, “100%” means the house sold exactly for the same amount as the listing price. “110% SPLP” means the house sold higher than the listing price by 10%, while “90% SPLP” means the house sold for less than the listing price by 10%.
According to this graph, an average home seller ended up selling about at about 100% of their asking price in all counties except Tarrant county, where the typical homeowner walks away with approximately 99% of their asking price. This means that, currently, there are enough motivated shoppers in the market to achieve the asking price, but not enough competition among the buyers to generate many bidding wars that were so prolific in 2021-2022.
For home shoppers, this graph is bad news. It demonstrates that their chances of getting home sellers to reduce their prices are pretty small. Although it also tells home shoppers that they will likely be able to avoid bidding wars with other home buyers, For home sellers, this graph is good news because that shows that when priced and marketed well, they should be able to avoid price cuts in the current market.
Want to outperform the market? Review the 72Sold program elements that have to do with getting the buyers to pay more than they initially intended.
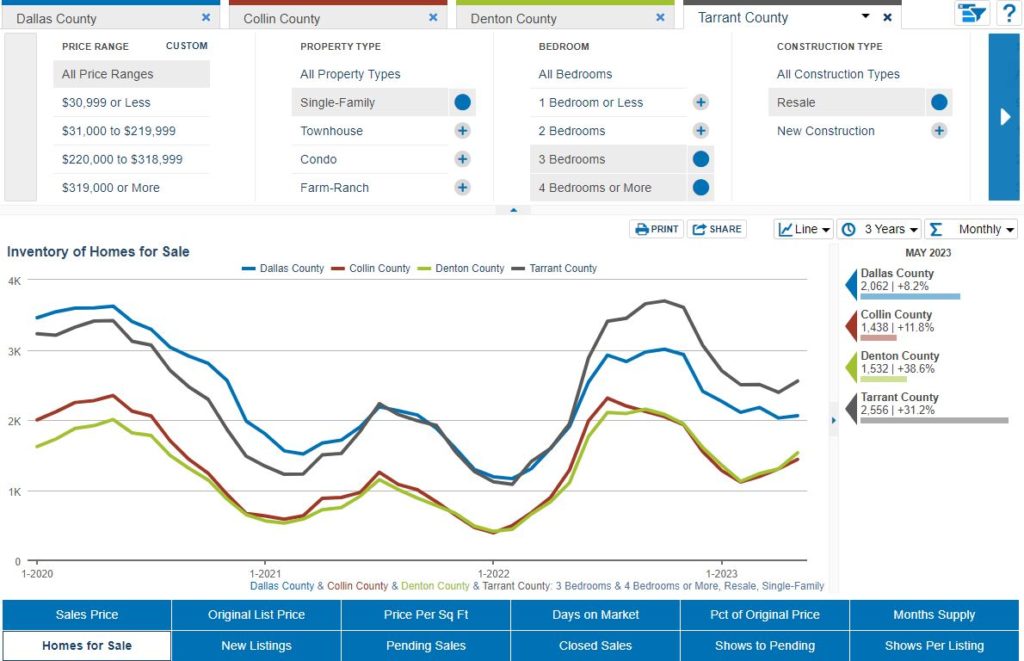
The DFW Overall Home Market Inventory Is At 2021-Level
Home sellers who started to panic-sell in the Summer and Fall of 2022 created a rare (for our area) “inventory surplus” that depressed prices throughout the DFW. As prices fell, many of the same sellers withdrew their homes from the market during the holiday, “shrinking” the surplus. As we predicted in our previous updates, the arrival of Spring and Summer made many parents start changing homes during the Summer break, selling their current homes and buying new ones.
The only exception to this trend is Dallas county, where the overall inventory of homes seems flat compared to February and April. The depressed inventory may lead to higher prices on homes and better sale outcomes for sellers in Dallas county.
We would expect the number of homes for sale to increase (which means “old stale listings” plus new arrivals) steadily in June and July. This inventory increase will create more competition among sellers, which should depress the prices somewhat. However, the total increase of homes available for sale is lower than we expected, possibly having to do with many home sellers being hesitant to let go of their low-rate mortgages and to jump into the new high-interest rate market. Right now, the DFW inventory of homes is similar to the numbers we have seen in 2021, but the high interest rates means fewer shoppers per house, which keeps the prices from rising up higher.
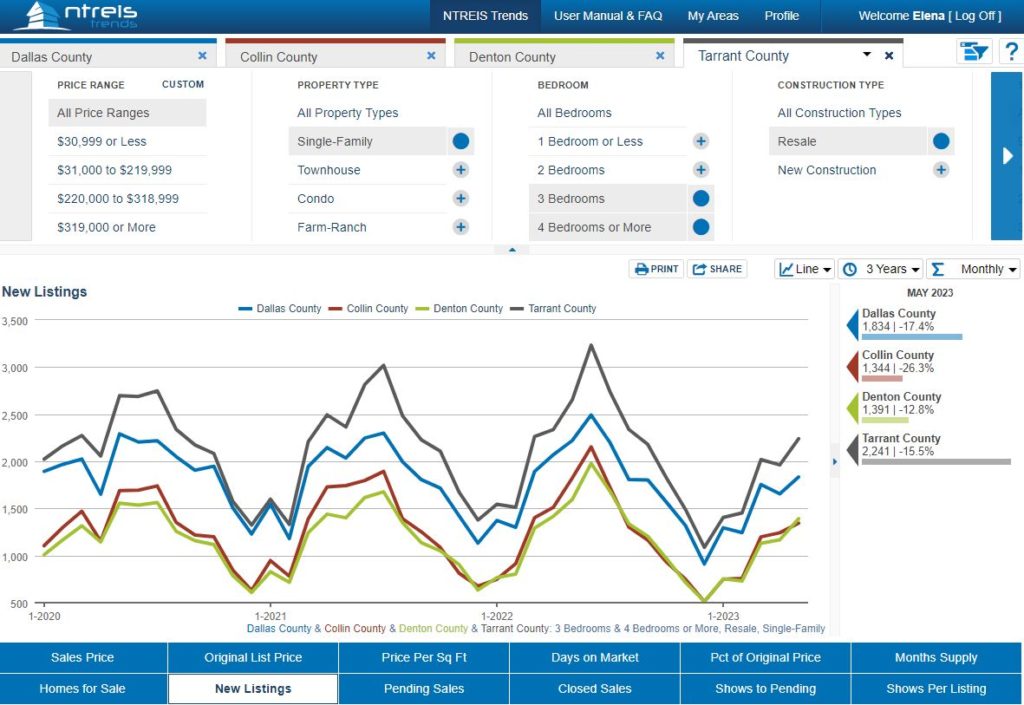
The Number of New Homes Coming on the Market Jumped in May
As expected, many sellers were waiting for the more seller-friendly Spring/Summer months to put their homes on the market. The graph below is showing that the 2023 market is behaving very similarly to the last 2-3 years.
The overall number of new homes placed for sale in March was highest in Tarrant and Dallas counties and lowest in Collin and Denton counties.
This year’s May trends seem to be in line with the previous years, which may serve as yet another signal that the market is normalizing DESPITE the fact that the interest rates are putting more strain on the buyers.
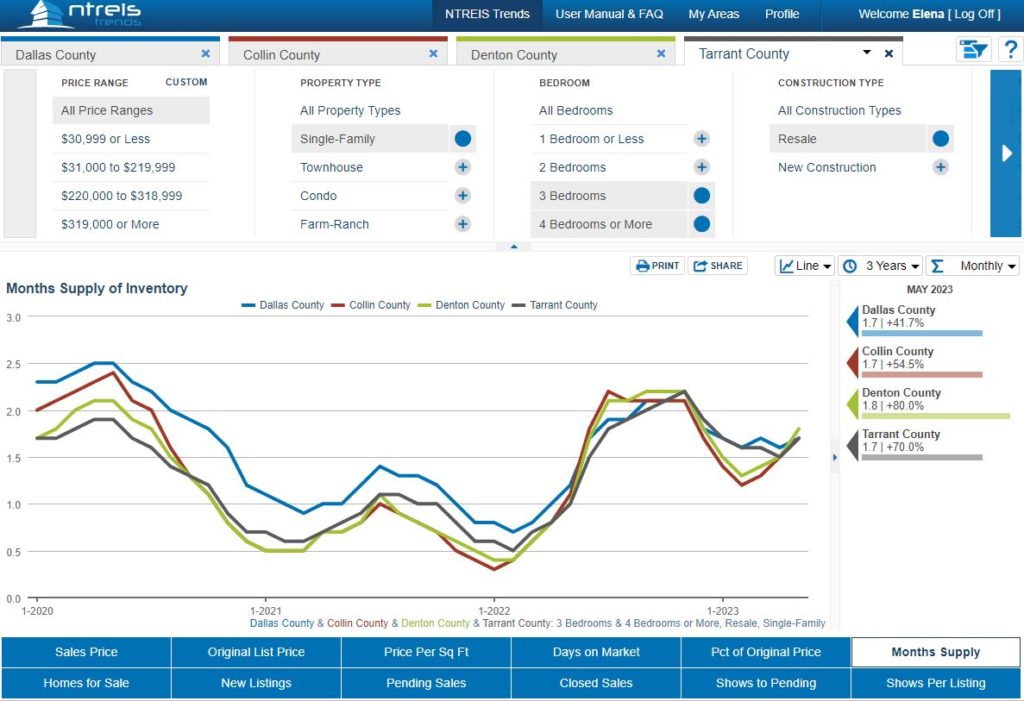
Months of Inventory
Months of inventory measurement is meant to determine how many months’ worth of purchasing activity could the area sustain if no new homes were listed for sale. Usually, any number below 4 months is supposed to indicate a seller market, any number above 4 months is supposed to indicate a buyer market,
As you can see, all four counties are showing nearly identical trends. The months of inventory indicator is currently at about 1.7 months of supply for all four counties, compared to 1.8 months of inventory in May 2022. This further indicates that the market is back to its prior trends.
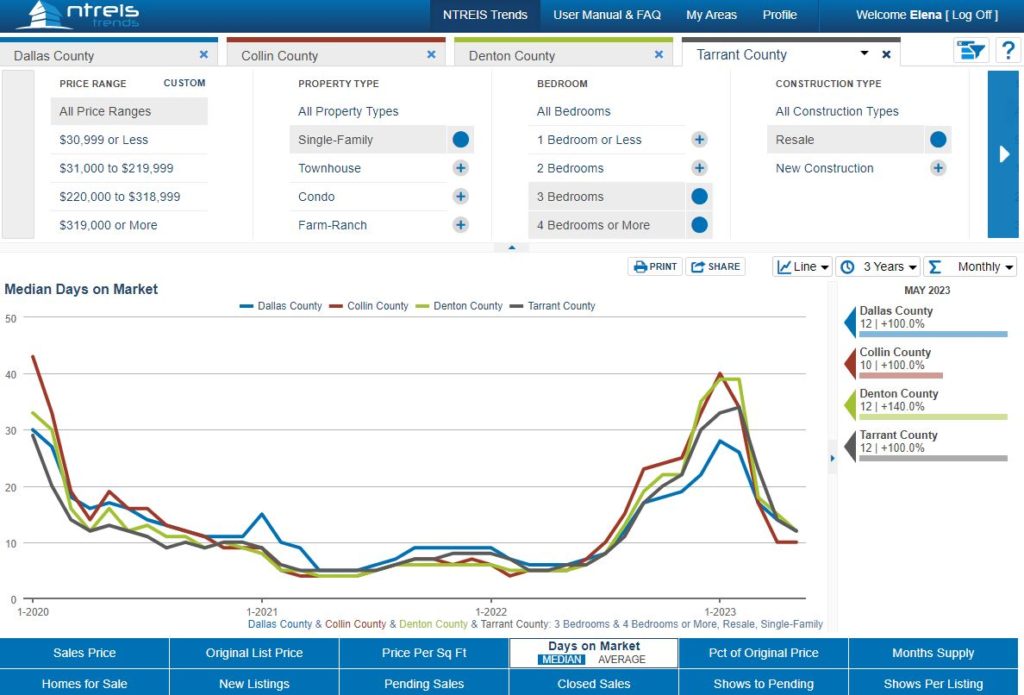
Days on the Market
Days on the Market is a measurement of how many days the average home takes to go under contract. Long days on the market typically show a slow, saturated, buyer-centric market where the supply exceeds demand. Short days on the market typically mean that the home buyers are buying aggressively, and it typically means that the demand is higher than the supply.
Currently, all 4 counties show that it takes 12 days on average to place a home under contract. In comparison, in May of 2022, the average days on market were 5-7 days. For home shoppers, it means that they cannot expect the average house to stay available for sale for more than 1-2 weekends, so they absolutely need to be shopping with their pre-qualification letters in hand to avoid losing their favorite homes to other shoppers.
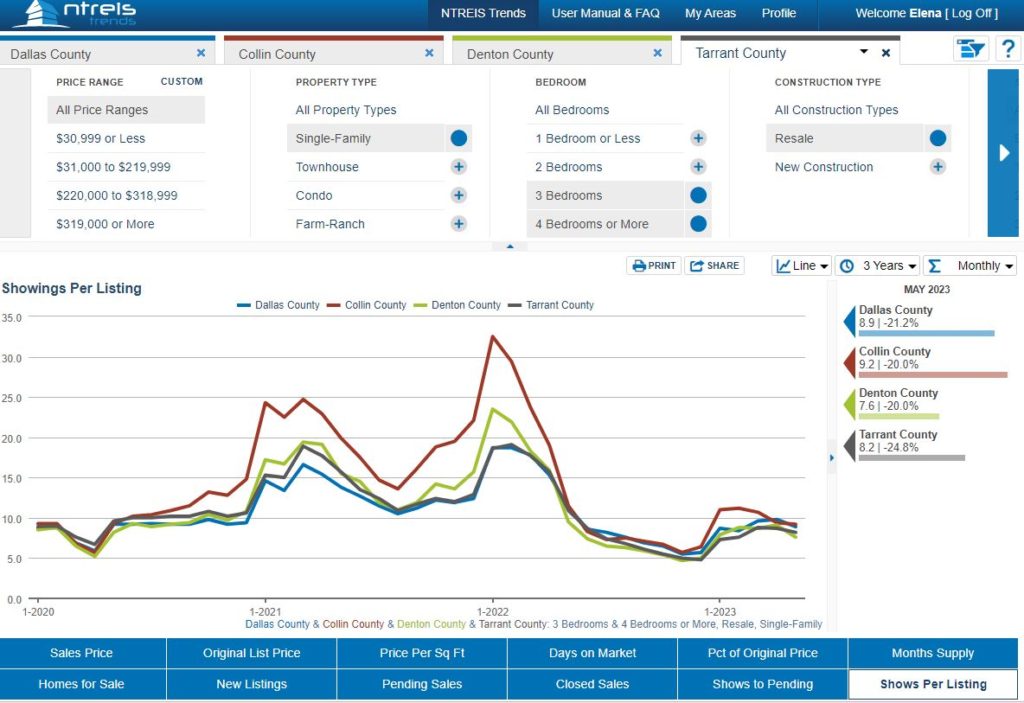
The Number of Buyers Looking at Homes Is Increasing
Speaking of “other home shoppers” (a.k.a competing buyers).
Based on the graph, an average home buyer should expect to compete with at least 8-9 other shoppers looking at the same home. In comparison, in January of this year, home shoppers were expected to compete with 8-11 other shoppers. This means that the number of motivated home shoppers has remained relatively flat (or even decreased) since January or February. This should serve as a caution to the home sellers not to price their homes too aggressively, as the number of shoppers willing to brave the high interest rate buyer experience remains relatively flat compared to 2022, when an average home saw 18-32 buyers competing for the same house.
What should home buyers and home sellers do in this changing market? I will be writing more on this topic shortly.

Want to see more stats and trends?

1-2-3-sold advertising opportunities blog buy4cash buyers covid-19 dfw housing market update FICO financial fitness for buyers for homeowners for investors for renters for sellers free materials holidays houses itin knowledge articles legal and financial market updates monthly updates mortgage owner financed houses rent-to-own seller financed houses selling as-is stats stats and trends taxes tips and tricks