

JANUARY 2023 – DFW HOME MARKET UPDATE
February 17, 2023
February 21, 2023 – by Elena Garrett, Realtor and 72Sold Area Director
We continue to observe as the trends in the DFW housing market is starting to look a bit more bullish for the home sellers, while still leaving room for the buyers to find a good deal on prices and seller concessions. Let’s look at the details.
A BRIEF REVIEW OF HOW WE GOT TO WHERE WE ARE NOW: For the past 6 months, the home market in the DFW has undergone DRASTIC changes. Sizzling-hot seller’s market that we observed in 2021 (and the first half of 2022) was subjected to a significant shock of the sharp increase in interest rates that immediately threw cold water on many buyers’ ability to pay higher monthly payments. The buyers pulled back sharply. As a result, from May 2022 to December 2022 home prices declined, on average, between $40,000 and $100,000, depending on the county. Home sellers across the DFW region suddenly found themselves in a much more difficult environment than they were during the COVID years. Many investors who bought fixer-uppers to remodel them found themselves unable to sell at a profit. Many builders who already “sold” homes under construction suffered from buyers backing out of contracts due to the interest rate increases. The backlog of unsold homes (both new construction and resale) started to form, depressing the prices even further. A large percentage of home sellers refused to sell at lower prices and simply withdrew their homes from the market in November-December, creating a drop in the inventory of available homes. I am speculating that many of these sellers are waiting until Spring 2023 to put their homes on the market again at more favorable prices. After Christmas, the Fed lowered the interest rate somewhat, sending encouraging signals to home buyers. As a result, since January 2023, buyer activity seems to have increased, and prices started to increase at least in some counties. The market price stats shown here show January closings, which are the contract that was written in December. The true effect of the January interest rate reduction won’t be known until March when the new batch of the stats arrives.
Check out below the trends that the home market data is showing for the 4 main counties in the DFW area: Dallas County, Collin County, Tarrant County, and Denton County.
ELENA’S PREDICTIONS FOR THE NEXT 4-6 MONTHS:
Since the market indicators have stabilized, it is very likely that this year will repeat the “Spring-Summer” price bubble of the previous years. The best times to buy at still-low prices are now expected to be from February to April. The best times to sell at the highest profit are now expected to be from May to July.
The good news for the shoppers: Home shoppers in February through April are likely to encounter home sellers who have been through the largest decline in home prices in the last 5 years, and as a result, they are somewhat willing to make price concessions to get the house sold in case they feel that their sale is not moving fast enough. If the case of home builders, at the moment many are carrying inventory that they need to get rid of before they can start on new projects, forcing the builders to offer generous “concession” packages (most of which, it seems, will only be in effect until March-April, which is important from many angles). In the case of individual home sellers of pre-owned homes, many sellers who want to sell faster are also willing to negotiate seller-funded interest rate buydowns or assistance with closing costs.
RECOMMENDATIONS:
Home sellers who are trying to sell in the first Q of 2023 would be advised to act quickly and decisively to have their homes sold in under 7-10 days, as the emboldened home shoppers are currently in the bargain-hunting mood. If at all possible, I would recommend that home sellers who are looking to get the highest amount for their property to consider timing the market and selling in May-July. Home buyers who are trying to buy in the next 2-3 months can still benefit from the inventory of homes that are still left over from the slower-than-expected Fall and Winter, in terms of having the power to negotiate lower prices, cash toward closing, or an interest rate buy-down. But closer to the Spring and Summer the market will most likely heat up again, making it more favorable to the sellers than to the buyers. It would be wise to conclude your home search in March-April and avoid shopping during the May – August period.
To the home sellers: we recommend seriously looking into the 72Sold home selling program which is designed to sell nearly any home within the first 72 hours of it being on the market – and, typically, at a higher price than competing homes. With the 72Sold approach, at the very least the home sellers will get the best chance to sell their homes at the top of today’s market and without having to do any price cuts or concessions.
DFW STATISTICS FOR JANUARY 2023
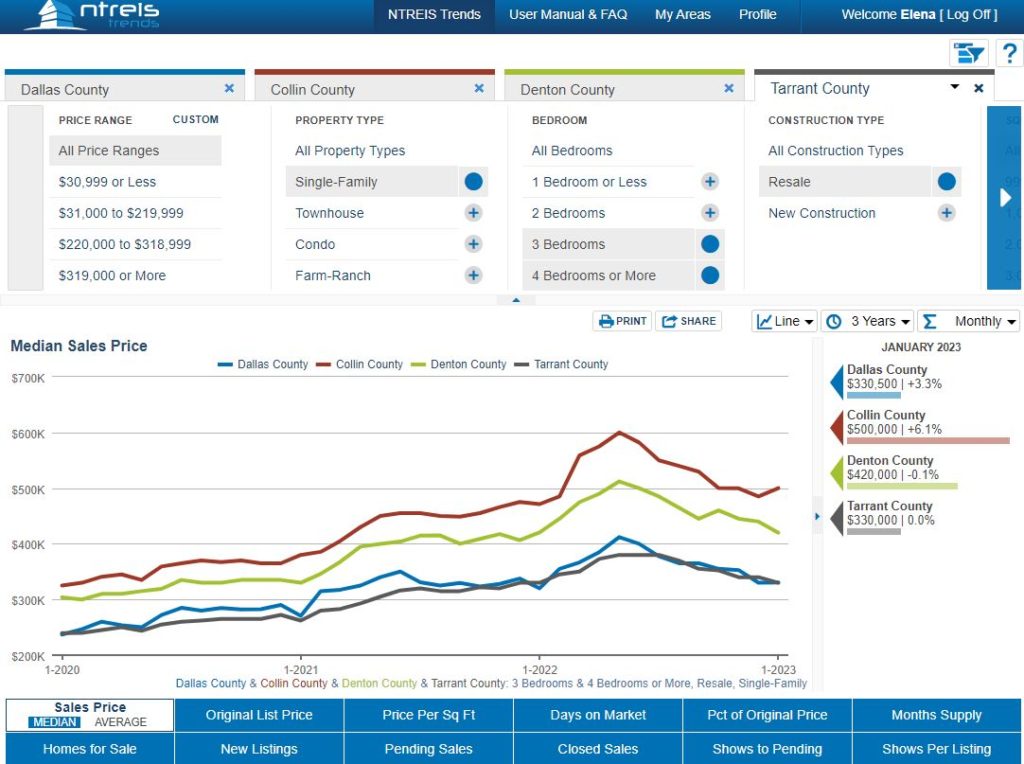
Home Prices Are Still Declining in Some Counties
As we have mentioned in our previous updates, home prices in the DFW area have suffered a decline since May 2022. In Collin County, median home prices (for 3 and 4-bedroom resale homes) have fallen, on average, by $115,000 or 19% since their peak values in May. In Dallas county, homes lost on average $82,000 or 20% of their value so far. In Tarrant County, homes lost on average $40,000 or 11% of their value since May. In Denton county, they lost on average $72,000 or 14% of their value since May.
However, we are starting to see home prices stabilizing. In Collin county, we see a slight increase in prices since December, In Dallas county, the median prices remain stable, with a very slight increase. In Tarrant county, home prices remained flat, with a very slight decrease. In Denton county – the median price dropped by nearly $20,000 in one month.
The declining home prices allow home buyers to counteract the effect of higher interest rates, as many motivated sellers currently offer “rate buydown’ options allowing home shoppers to capitalize on lower interest rates AND on lower home prices overall.
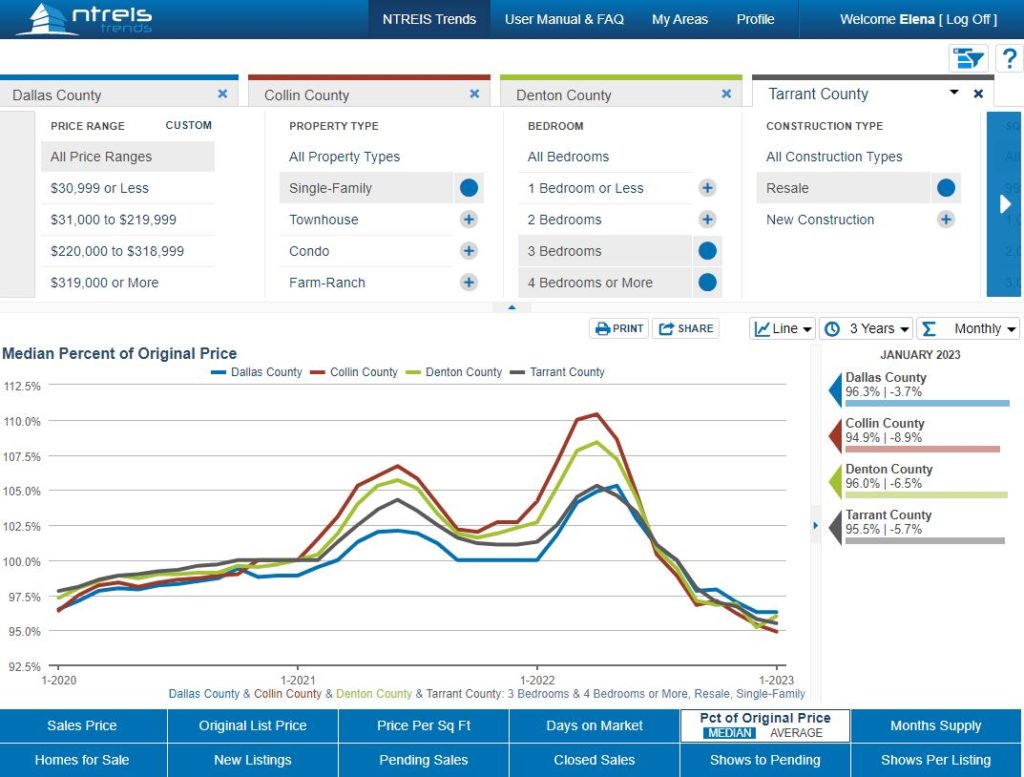
Price Cuts Are Slowing Down for the First Time Since October
The graph below shows you how much in terms of percent of the asking price the house sold for. For example, “100%” means the house sold exactly for the same amount as the listing price. “110% SPLP” means the house sold higher than the listing price by 10%, while “90% SPLP” means the house sold for less than the listing price by 10%.
According to this graph, an average home seller ended up selling about 5% below their initial asking price. In the Dallas and Denton counties, we observe that fewer sellers had to cut their prices in order to sell.
For home shoppers, this graph is great news. It demonstrates the possibility of a bargaining position for home buyers. For home sellers, this means that deliberate measures need to be taken to avoid sharing the fate of those homeowners who had to make drastic price concessions. Review the 72Sold program elements that have to do with getting the buyers to pay more than they initially intended.
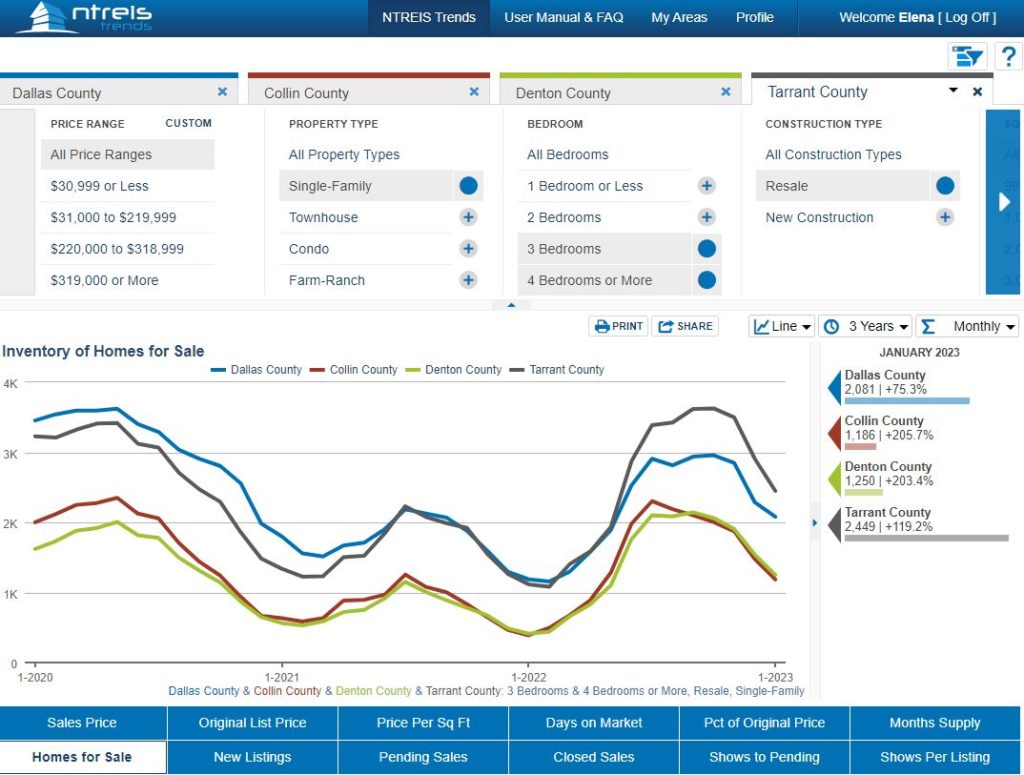
The DFW Home Market Inventory is Still Shrinking
Many home sellers withdrew their homes from the market during the holidays, reducing the number of unsold homes on the market. Typically, we would expect to see a rise in inventory in January, but so far the overall number of homes for sale is not increasing. Instead, many sellers continue to pull their homes off the market.
We would expect the number of homes for sale to increase closer to Spring.
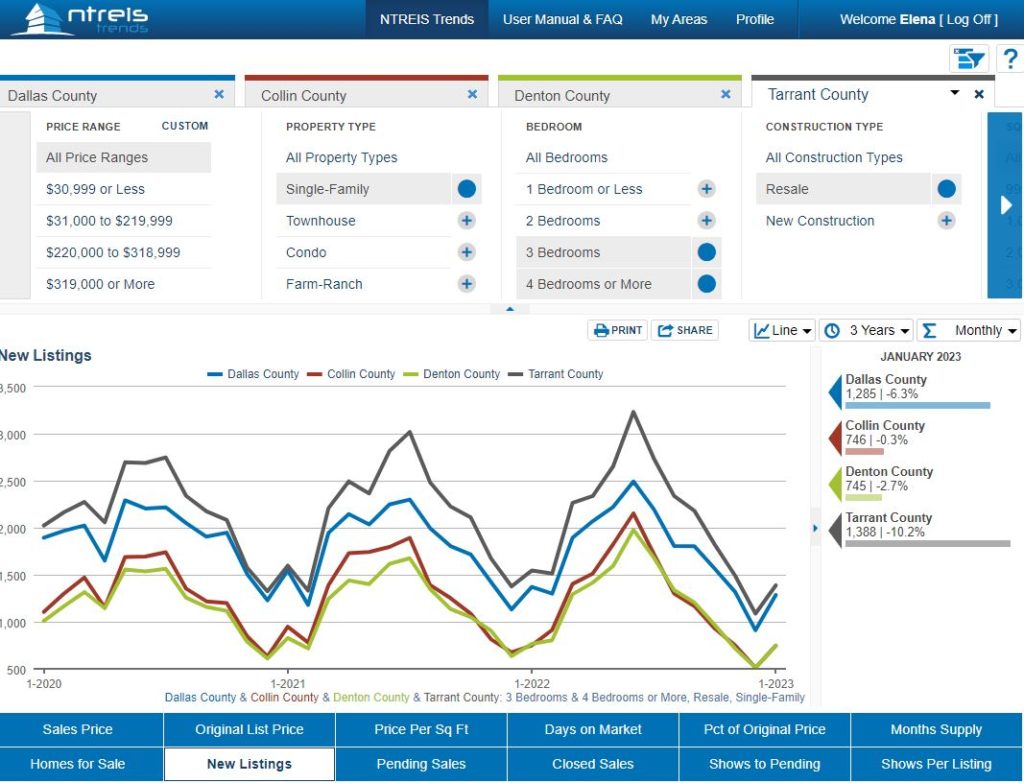
The Number of New Homes Coming on the Market Remained Low
As expected, many sellers were waiting for the more seller-friendly Spring/Summer months to put their homes on the market. However, in January a number of home sellers felt confident enough that they put their homes on the market without waiting for the warm weather to come.
The number of new home sellers was highest in Tarrant county, and lowest in Collin and Denton counties.
This year’s January trend seems to be in line with the previous years, which may signal that the market is normalizing for now.
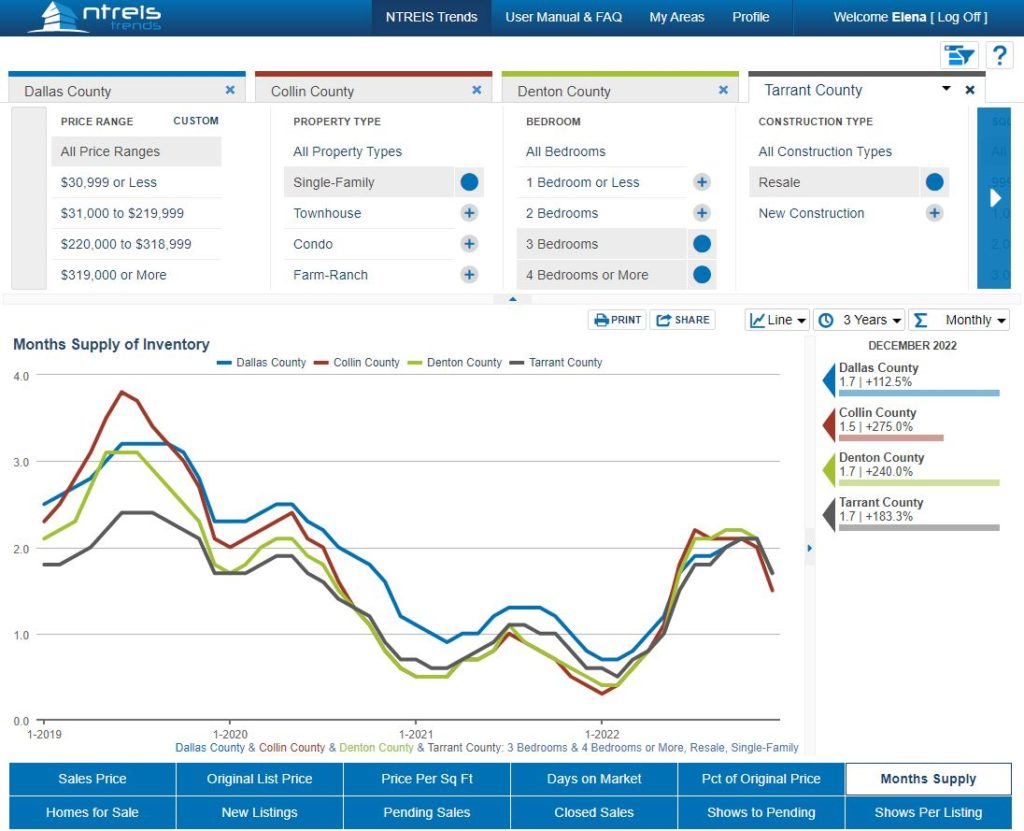
Months of Inventory
Months of inventory measurement is meant to determine how many months’ worth of purchasing activity could the area sustain if no new homes were listed for sale. Usually, any number below 4 months is supposed to indicate a seller market, any number above 4 months is supposed to indicate a buyer market,
As you can see, all four counties are showing nearly identical trends. The months of inventory indicator is currently at about 1.5-1.7 months of supply for all four counties, compared to 2 months of inventory just a few weeks ago. This indicates that the market shifted toward the sellers in January 2022.
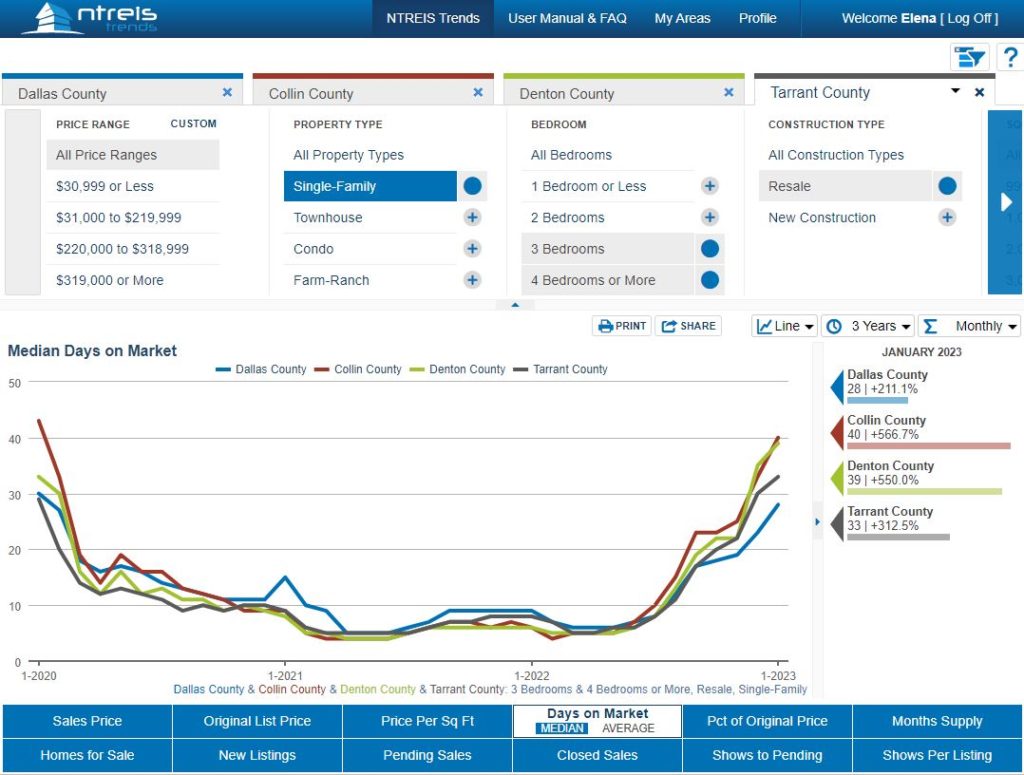
Days on the Market
Days on the Market is a measurement of how many days the average home takes to go under contract. Long days on the market typically show a slow, saturated, buyer-centric market where the supply exceeds demand. Short days on the market typically mean that the home buyers are buying aggressively, and it typically means that the demand is higher than the supply.
Some counties seem to be selling homes at a slower pace than others. Collin county and Denton county have an average of 40 days on the market while Denton and Tarrant counties are selling homes faster. Overall, in all four counties, the homes are on the market twice as long as they used just a year ago.
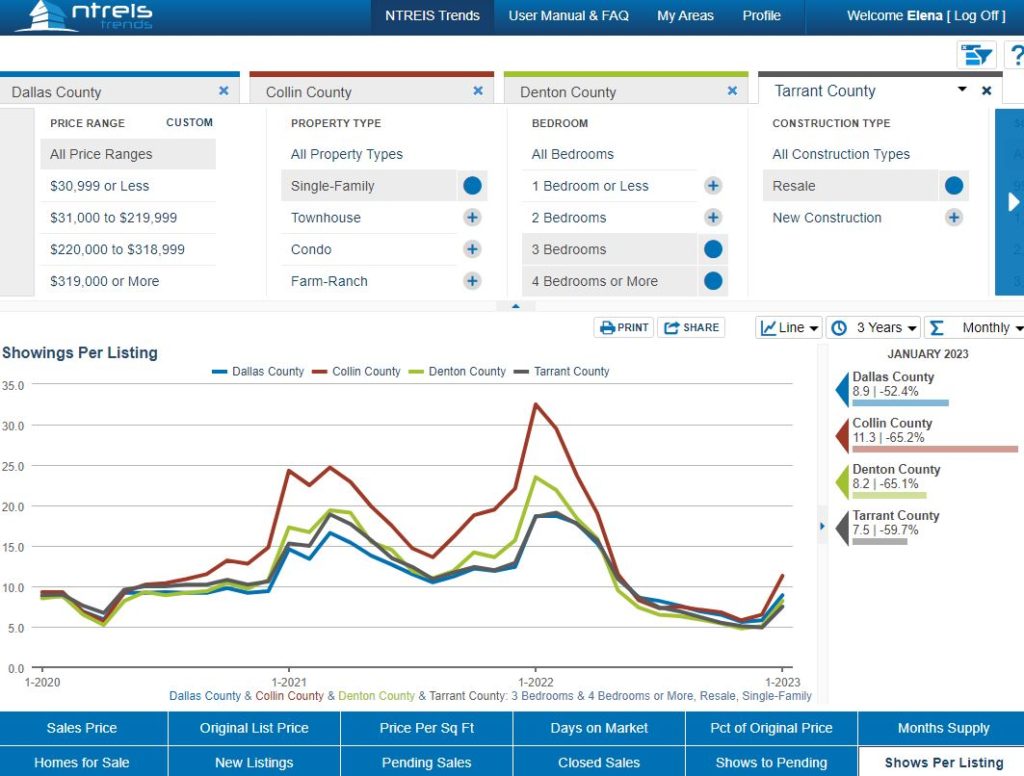
The Number of Buyers Looking at Homes Is Increasing
Based on the graph, the number of people looking at homes has nearly doubled from November to January in all 4 counties.
That means that there is now more competition among the buyers, and that is great news for home sellers but bad news for home buyers.
What should home buyers and home sellers do in this changing market? I will be writing more on this topic shortly.

Want to see more stats and trends?

1-2-3-sold advertising opportunities blog buy4cash buyers covid-19 dfw housing market update FICO financial fitness for buyers for homeowners for investors for renters for sellers free materials holidays houses itin knowledge articles legal and financial market updates monthly updates mortgage owner financed houses rent-to-own seller financed houses selling as-is stats stats and trends taxes tips and tricks