

December 2022 – DFW Home Market Update
January 24, 2023
January 22, 2023 – by Elena Garrett, Realtor and 72Sold Area Director
As I mentioned in my previous update, the trends in home buyers’ shopping behavior are starting to normalize and become more predictable.
IMPORTANT: For the past 6 months, the home market in the DFW has undergone DRASTIC changes. Home prices declined, on average, between $40,000 and $100,000, depending on the county. Home showings plummeted. The increasing number of unsold homes created a logjam of unsold inventory that persisted until about October, when many would-be-home sellers decided NOT to sell in 2022 and to wait to sell. As a result, many of those unsold homes canceled their listings in November and in December, dropping the home inventory numbers in all major counties.
However, with the start of the new year and the end of the holidays, the trends may start to shift. Any buyers looking to buy in 2023 would probably be best advised to buy as early in the year as possible, while the trend is still favorable to the buyers.
Check out below the trends that the home market data is showing for the 4 main counties in the DFW area: Dallas County, Collin County, Tarrant County, and Denton County.
ELENA’S PREDICTIONS:
Home shoppers in January and February are likely to encounter home sellers who have been through the largest decline in home prices in the last 5 years, and as a result, are more willing to make price concessions to get the house sold. The inventory of homes is likely to go up in January and February. Many home sellers who have taken their homes off the market in December will turn around and place their homes back for sale.
Home sellers who are trying to sell in the first Q of 2023 would be advised to act quickly and decisively to have their homes sold in under 7-10 days, as the emboldened home shoppers are currently in the bargain-hunting mood. Any home with “days on market” over 10 days may run into buyers making lower and lower offers, as the buyers have a lot of choices of homes with motivated sellers this month. We recommend seriously looking into the 72Sold home selling program which is designed to sell nearly any home within the first 72 hours of it being on the market – and, typically, at a higher price than competing homes. With the 72Sold approach, at the very least the home sellers will get the best chance to sell their homes AT THE TOP of today’s market, rather than watch their home values decline further.
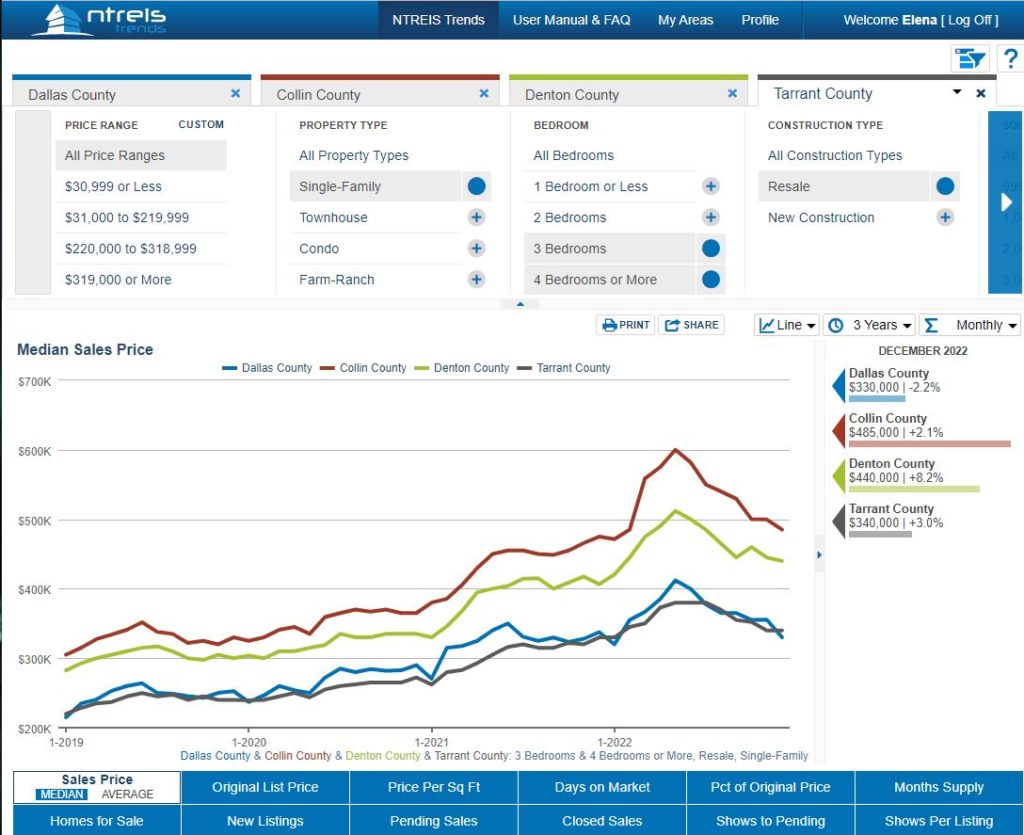
Home Prices Are Declining, Still
As we have mentioned in our previous updates, home prices have been declining since May in all 4 counties, reversing the gains made earlier this year. In Collin County, median home prices (for 3 and 4-bedroom resale homes) have fallen, on average, by $115,000 or 19% since their peak values in May. In Dallas county, homes lost on average $82,000 or 20% of their value so far. In Tarrant County, homes lost on average $40,000 or 11% of their value since May. In Denton county, they lost on average $72,000 or 14% of their value since May.
In month-over-month trends, homes in Collin county lost on average $15,000 of their value from November to December (therefore, one could say they remained flat). In Dallas county, the median prices declined on average by $5,500 since November. In Tarrant county, home prices remained flat since last month. In Denton county – an average decrease of $5,o00.
The declining home prices allow home buyers to counteract the effect of higher interest rates, as many motivated sellers currently offer “rate buydown’ options allowing home shoppers to capitalize on lower interest rates AND on lower home prices overall.
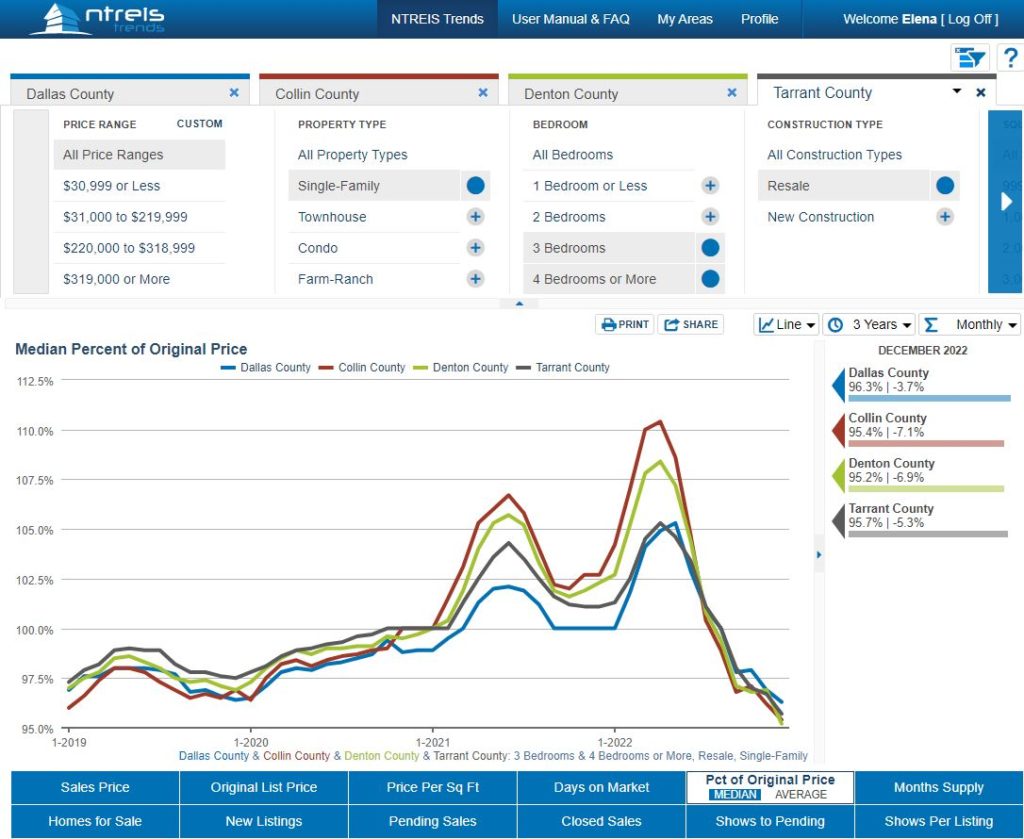
Sellers are Cutting Prices Even Deeper to Find Buyers
The graph below shows you how much in terms of percent of the asking price the house sold for. For example, “100%” means the house sold exactly for the same amount as the listing price. “110% SPLP” means the house sold higher than the listing price by 10%, while “90% SPLP” means the house sold for less than the listing price by 10%.
We can see that ALL counties in the graph show a sharp downward trend. Home sellers are doing price cuts at a scale virtually unheard of in the last 5 years. All counties are now showing that the average home sells at 5% BELOW the asking price in November of 2023, compared to 5%-11% above the asking price in April, for example. In November, their price cuts stood at 3%-4% of the original home price. The data was gathered in December, so it is possible that sharper price cuts may have been driven by the decision to sell their homes in December, during the difficult holiday season. We will be continuing to watch the price cut trends in upcoming months.
For home shoppers, this graph is great news. It demonstrates the increased bargaining position of home buyers. For home sellers, this means extraordinary measures need to be taken to avoid sharing the fate of those homeowners who had to make drastic price concessions. Review the 72Sold program elements that have to do with getting the buyers to pay more than they initially intended.
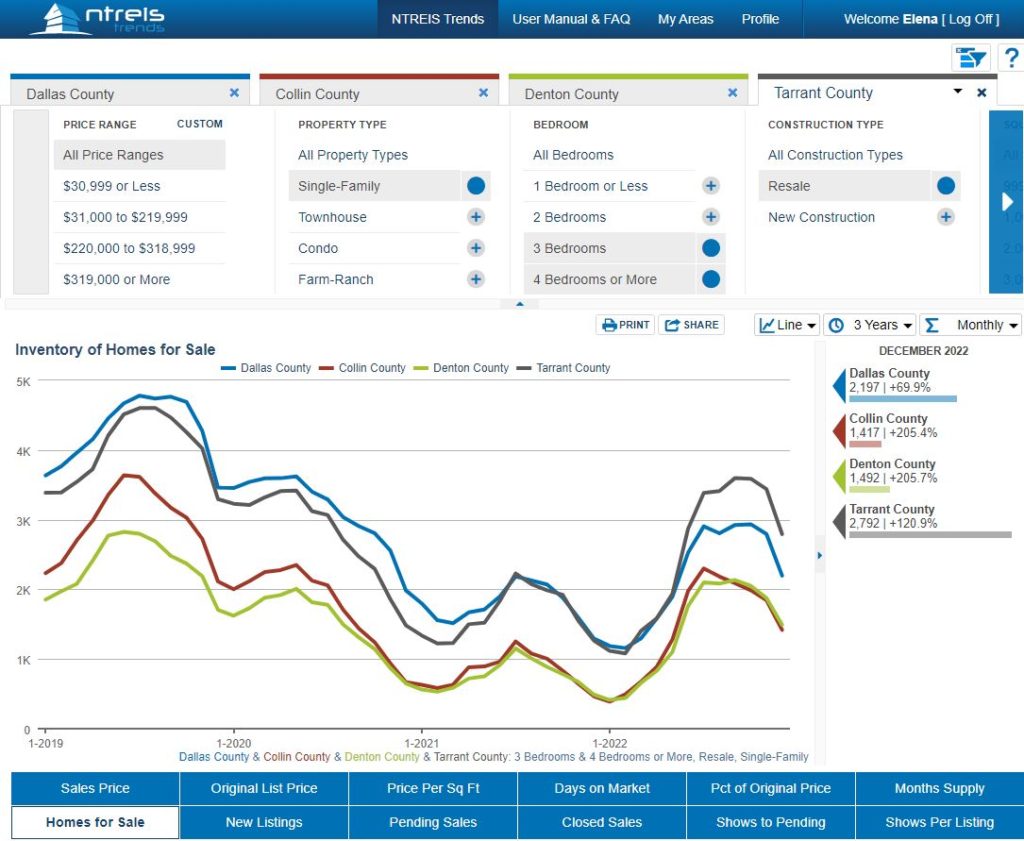
The DFW Home Market Inventory Declined During Holidays
As we predicted in our previous articles, many home sellers withdrew their homes from the market during the holidays. This includes the sellers who probably planned to put the homes back for sale right after the holidays.
This trend is not unique to 2022. Traditionally, the number of homes for sale drops in the colder months of the year.
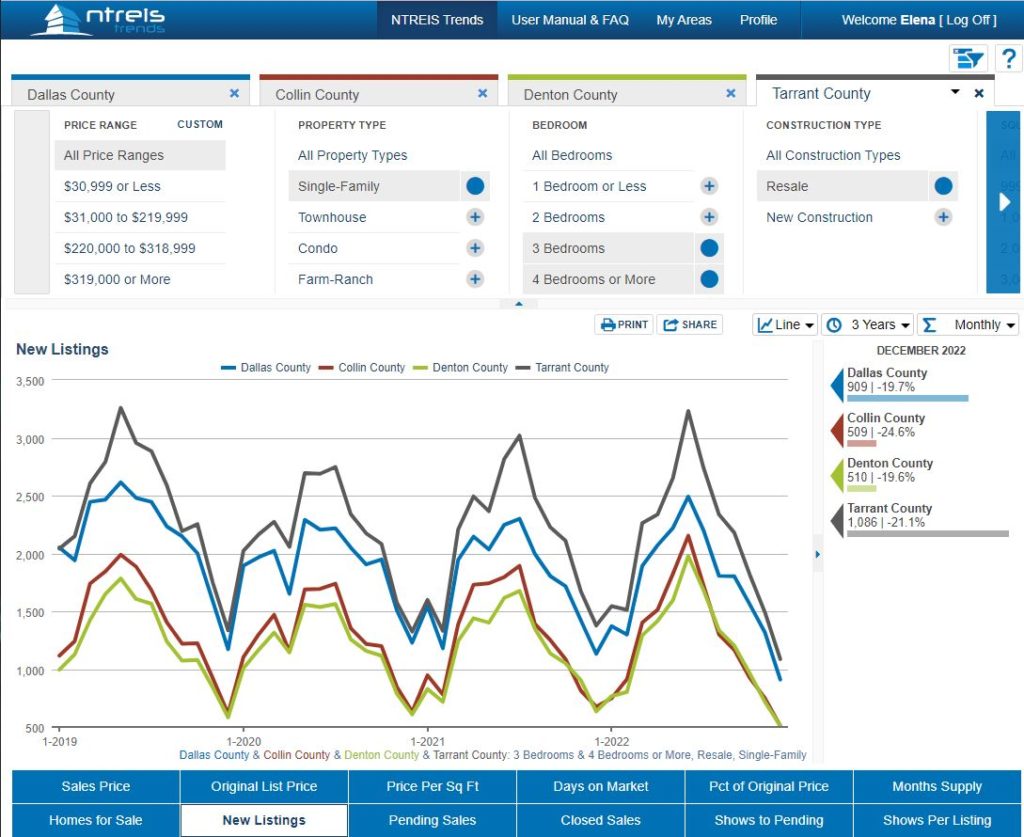
The Number of New Homes Coming on the Market Remained Low
Very few home sellers decided to brave the market and put their homes for sale in December.
The “holiday freeze” trend is pretty typical for this time of the year.
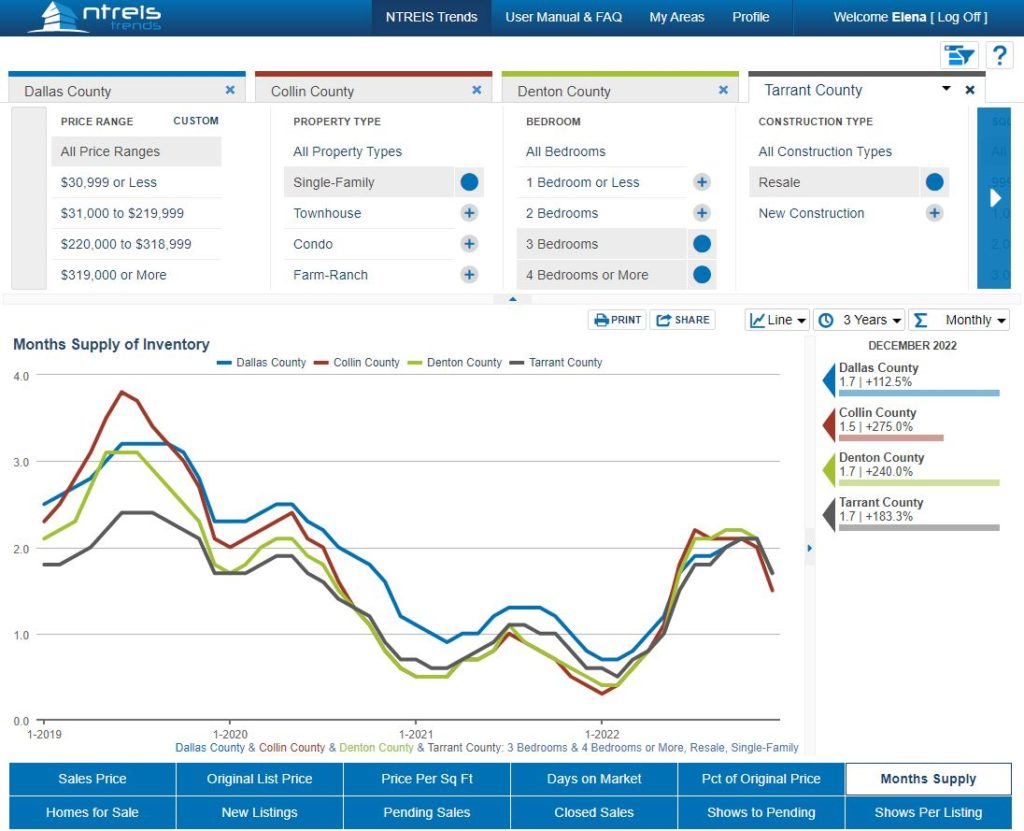
Months of Inventory
Months of inventory measurement is meant to determine how many months’ worth of purchasing activity could the area sustain if no new homes were listed for sale. Usually, any number below 4 months is supposed to indicate a seller market, any number above 4 months is supposed to indicate a buyer market,
As you can see, all four counties are showing nearly identical trends. The months of inventory indicator is currently at just below 2 months of supply for all four counties, which means that the market is cooling down for the sellers but is far from the buyer market yet. Right now, I would say that the market is more balanced than it has been since 2019-early 2020, but the market is far from being a “buyers market” at the moment.
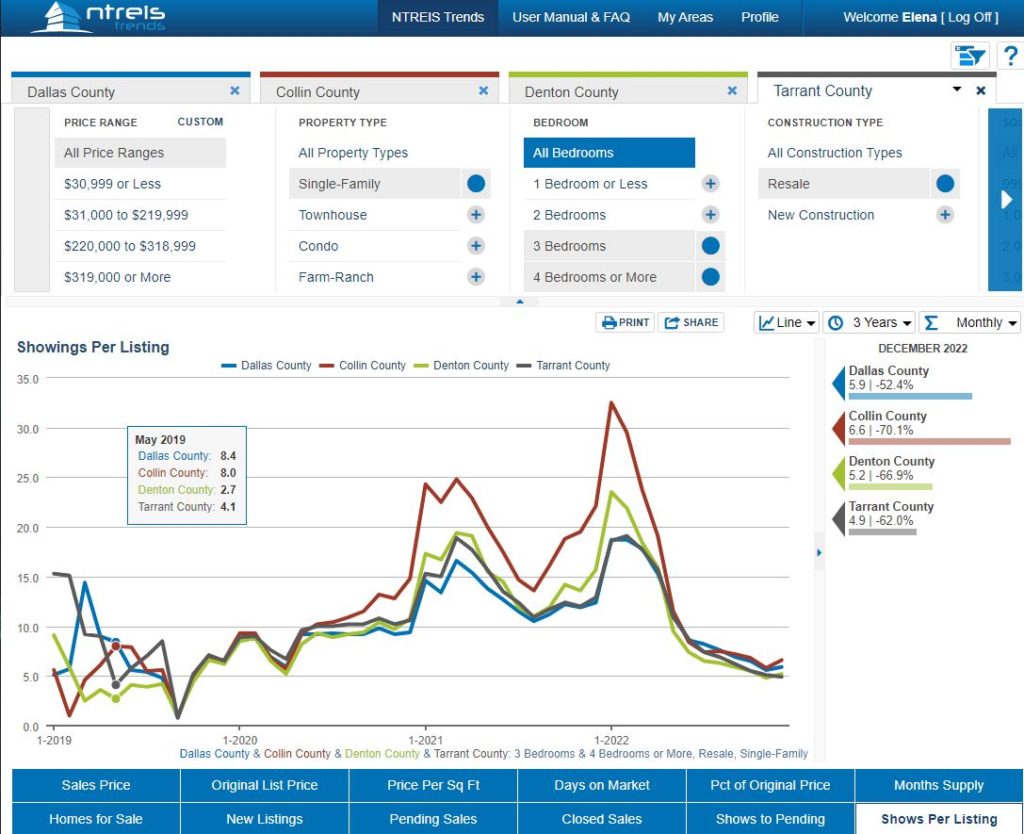
The Number of Buyers Looking at Homes Remains Relatively Low
Based on the graph, the number of people looking at homes continues to drop (thanks to the high interest rates). If in January 2022 or February 2022, the average home had 20-40 showings before going under contract, then 12 months later the number of showings is 5-7 per home.
That means that there is less competition among the buyers, encouraging the buyers to make less generous offers. To combat this issue, our recommendation to home sellers would be to look closely at the components of the 72Sold program that deal with increasing the number of home showings through its unparalleled marketing strategies.
What should home buyers and home sellers do in this changing market? I will be writing more on this topic shortly.

Want to see more stats and trends?

1-2-3-sold advertising opportunities blog buy4cash buyers covid-19 dfw housing market update FICO financial fitness for buyers for homeowners for investors for renters for sellers free materials holidays houses itin knowledge articles legal and financial market updates monthly updates mortgage owner financed houses rent-to-own seller financed houses selling as-is stats stats and trends taxes tips and tricks