
July 2022 – DFW Market Update
August 21, 2022
Aug 20, 2022
As DFW buyers and sellers are adjusting to the new reality of higher interest rates, a new trend is starting to set in. There are fewer buyers shopping for homes, but those who are in the market at the moment are making offers quickly (possibly rushing to lock in the current rates before they go up again). The overall number of homes for sale is similar to last year’s volume, but the number of showings per house is down significantly from the same month last year.
How do those changes affect the homeowners who are planning to sell this year? I think it is important to start by looking at the trends that the realtors’ data is showing for the 4 main counties in the DFW area: Dallas county, Collin County, Tarrant County, and Denton County.
Let’s take a look at the main indicators.
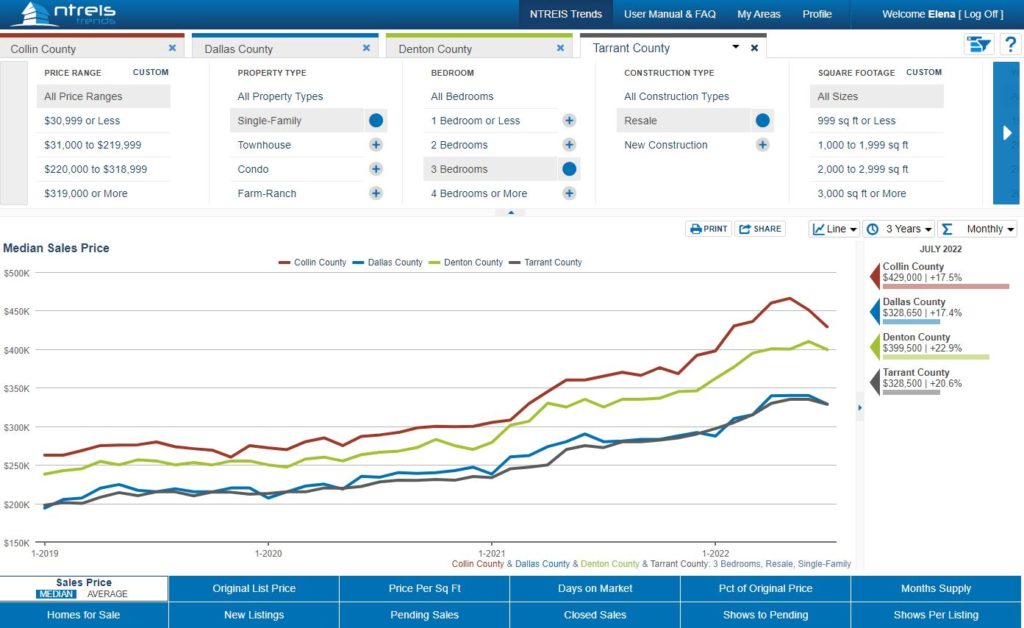
Home Prices Plateau
We can see that Collin county is showing the sharpest decline in prices for the 3rd month in a row, but all other counties in the graph are trending somewhat downward, although less dramatically than many people have predicted.
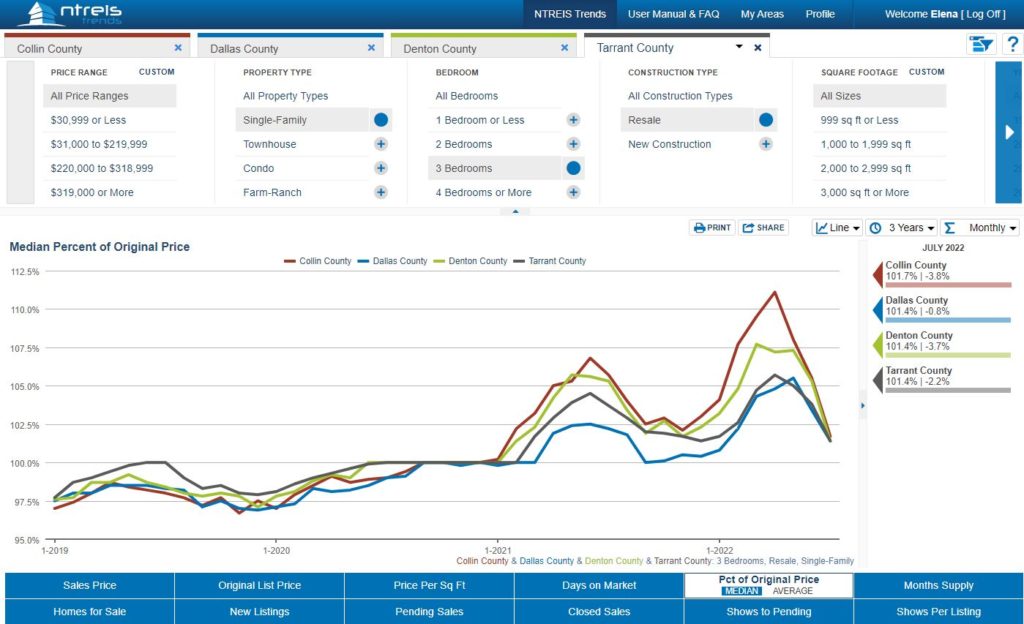
Bidding Wars are Less Fierce But Still Continue
The graph below shows you how much in terms of percent of the asking price the house sold for. For example, “100%” means the house sold exactly for the same amount as the listing price. “110% SPLP” means the house sold higher than the listing price by 10%, while “90% SPLP” means the house sold for less than the listing price by 10%.
We can see that ALL counties in the graph show a sharp downward trend. All counties are now showing that the average home sells at about 1%-2% over the asking price, compared to 5%-11% above the asking price in April, for example.
I would predict that as we head into colder months, the homes will start selling at the asking price or slightly below.
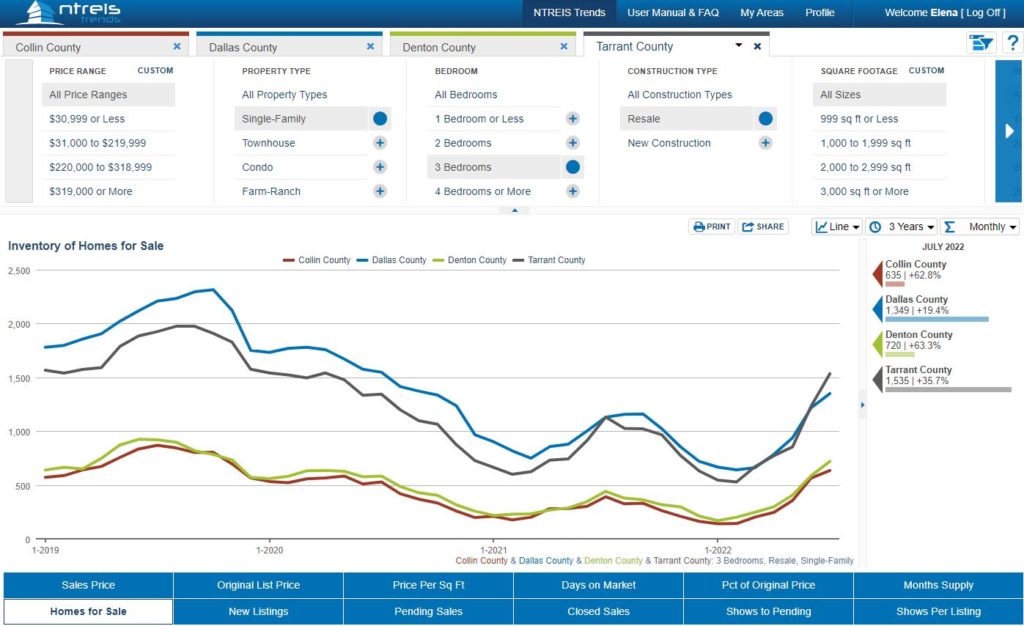
Are More Homes Available for Sale Now?
Based on the graph, the total number of homes for sale continues to trend up.
Total number of homes is based on ALL homes that are available for sale, both arrivals and homes that have been on the market for a while.
The uptick in the unsold inventory may also indicate that the sellers who started the process thinking about selling at a particular price may be unwilling to cut their prices lower, waiting for the interest rates to stabilize. That also means that the buyers now have more homes available to them, and that the competition between sellers may be growing.
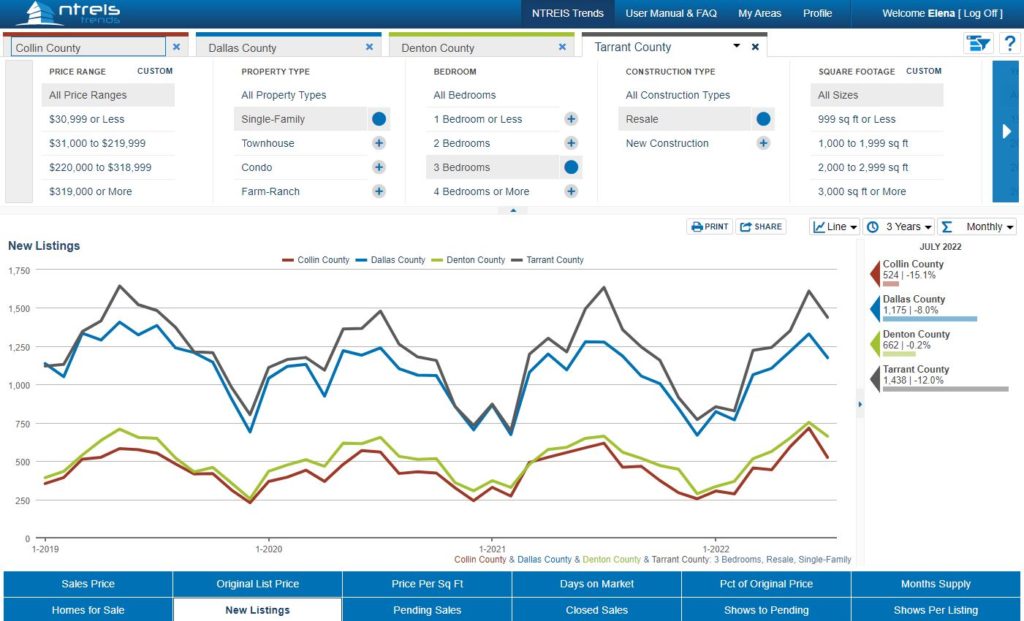
New Homes Coming on the Market Are Slightly Higher Than What They Were Last Year
Based on the graph, as the total inventory is going up, the number of new homes entering the market is starting to decline, which means that new sellers are no longer eager to put their homes on the market and prefer to wait and see. Also, as the school year is starting, fewer parents want to deal with the hassle of home showings in the middle of the school year.
I would predict the number of new homes to decline, as there is apparently no immediate “big sell-off” on the horizon.
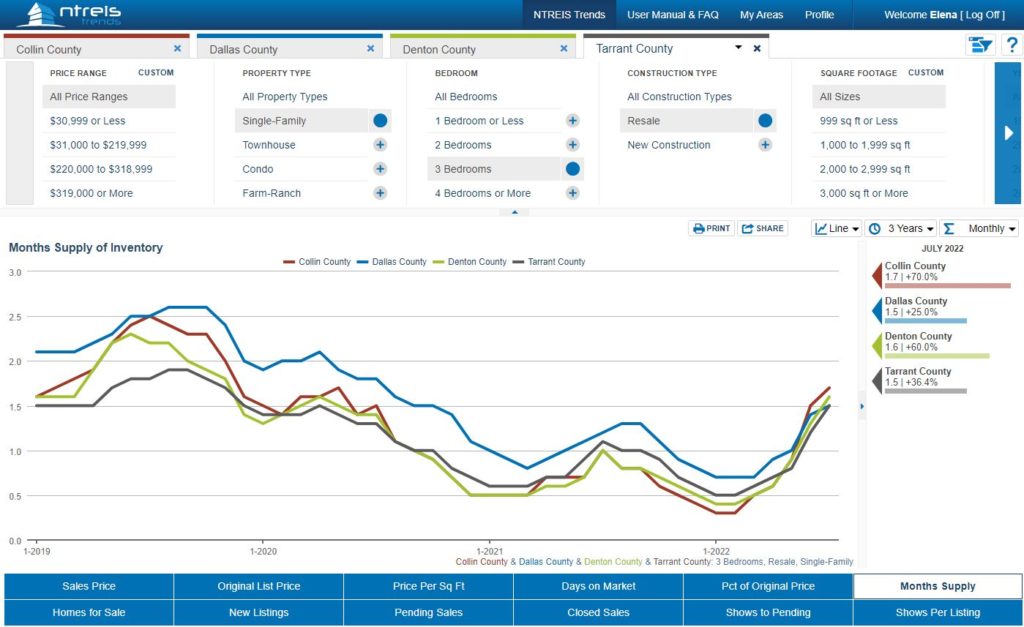
Months of Inventory
Months of inventory measurement is meant to determine how many months’ worth of purchasing activity could the area sustain if no new homes were listed for sale. Usually, any number below 4 months is supposed to indicate a seller market, any number above 4 months is supposed to indicate a buyer market,
As you can see, allfour counties are showing nearly identical trends. The months of inventory is trending higher, which means that the market is cooling down for the sellers. Also, the current months of inventory indicators are very similar in timing (but higher) than what we were seeing last year while the interest rates were still low. This is an encouraging sign for the sellers.
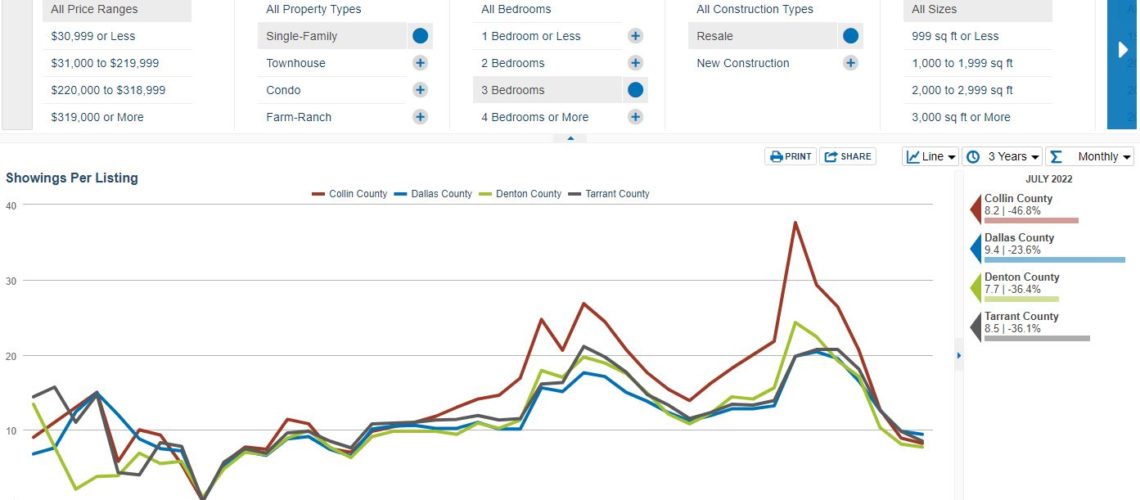
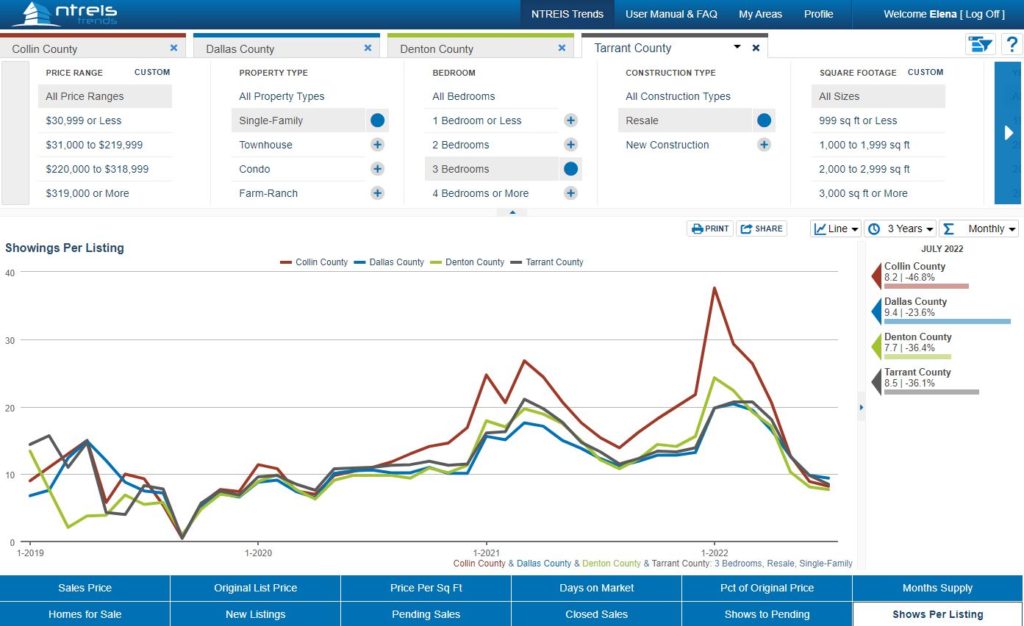
The Number of Buyers Looking at Homes Declines Sharply for Two Months in a Row
Based on the graph, the number of people looking at homes is nearly half of what it used to be just a couple of months ago (thanks to rising interest rates), but it stopped dropping and is stabilizing. If in January or February the average home had 20-40 showings before going under contract, in June and July those numbers dropped to 8-10 showings.
That means that there is less competition among the buyers, leading to buyers making less generous offers.
What should home buyers and home sellers do in this changing market? I will be writing more on this topic shortly.

72sold advertising opportunities artículos en español blog buy4cash buyers Canadian citizens cash offers creative financing dfw housing market update events financial fitness for buyers for homeowners for investors for renters for sellers holidays home purchase contracts and forms houses industry news international home buyers itin knowledge articles legal and financial market updates monthly updates mortgage moving to Texas owner financed houses RECA educational center rent-to-own seller financed houses selling as-is special program stats stats and trends taxes tips and tricks videos videos for home buyers videos for investors videos for sellers