

Easter Bunny’s March 2020 Real Estate Update
April 12, 2020
Dallas – Collin – Tarrant – Denton counties of North Texas
Good morning, North Texas! It is Easter morning of 2020, we are in the midst of the COVID-19 epidemic, and the clouds are hanging over the Texas residential real estate market. Or do they?
Today, instead of chocolate eggs, this Easter Bunny is bringing you some no-spin info on the STATE OF TEXAS REAL ESTATE
Below are the North Texas MLS stats as of the end of March 2020.
We know that March 2020 has been a mixed month, where in the first part of the month we were still not under stay-at-home orders. The graphs below represent AVERAGES for the entire month of March. The month started very strongly, so it might be skewing the data.
At least for now, the picture for most parameters looks not that bad.
The average number of new listings of single-family homes (existing construction)
January 2019- March 2020
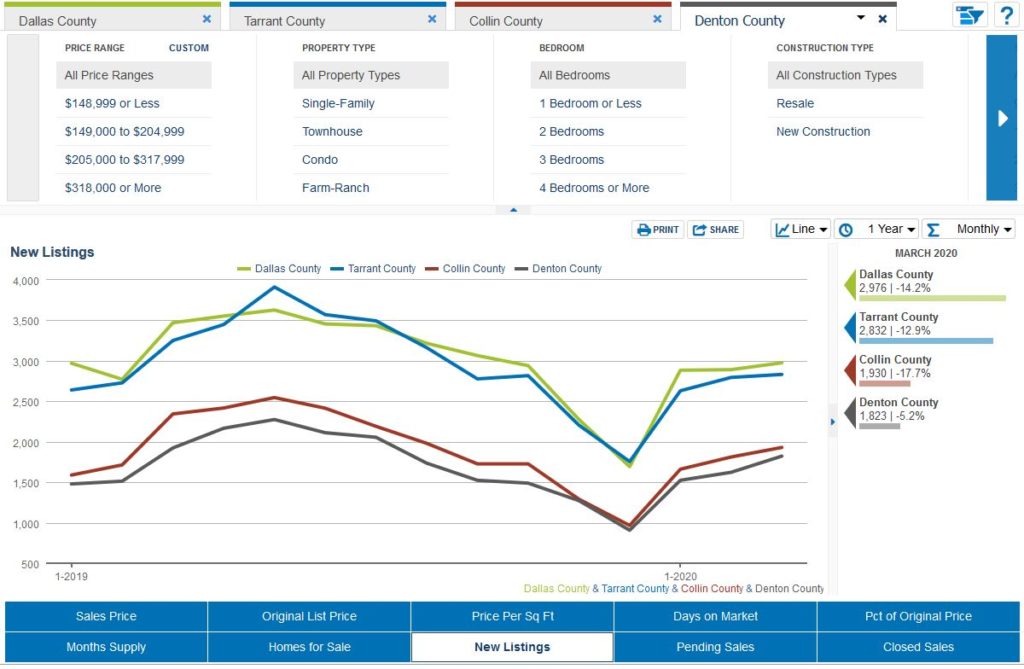
Depending on the county, the new listings numbers look slightly down, especially for Dallas county. But the drops were not that catastrophic.
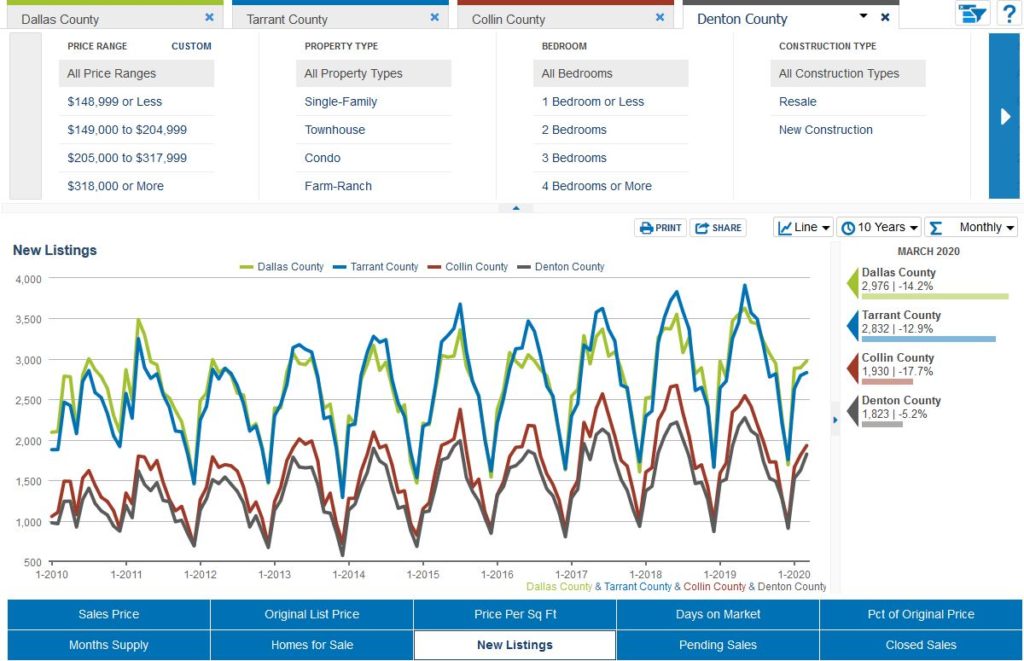
Just for context, here is how the numbers look on a 10-year scale. As you can see, real estate is highly cyclical, and it would be interesting how much the COVID-19 situation disrupts the usual yearly cycle this year
The average number of closed sales of single-family homes (existing construction)
January 2019- March 2020
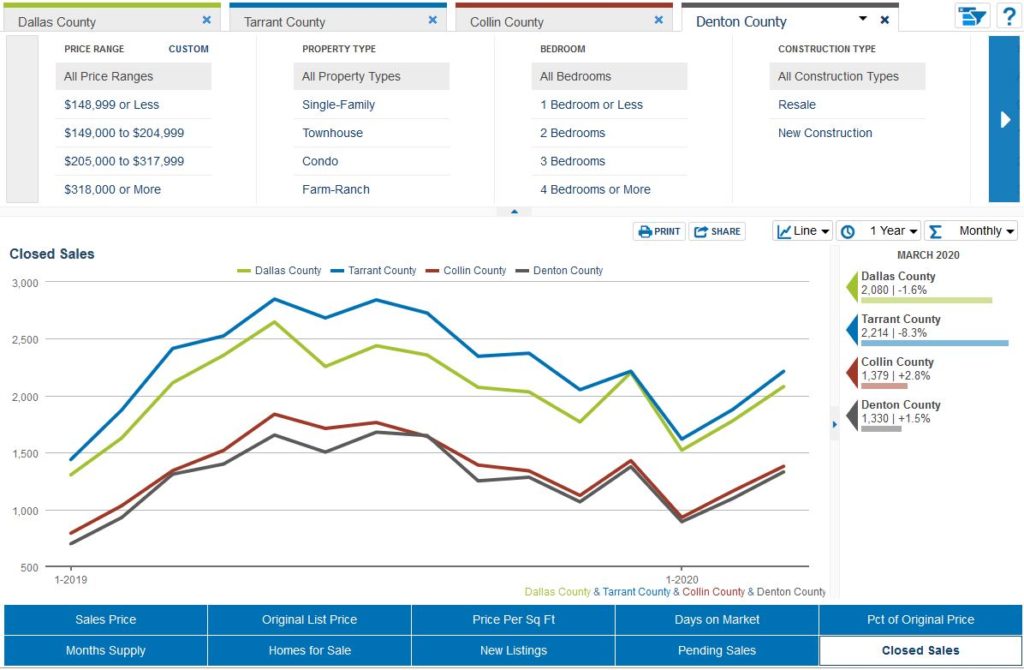
We have some drops in Dallas and Tarrant counties, but a slight improvement in Collin and Denton counties. Again, this is the average for the entire month of March 2020, so the numbers at the beginning of the month were probably stronger than the numbers of the end of the month.
Overall, however, we have fairy small reduction in Dallas and Tarrant counties, but a slight increase in Collin and Denton counties.
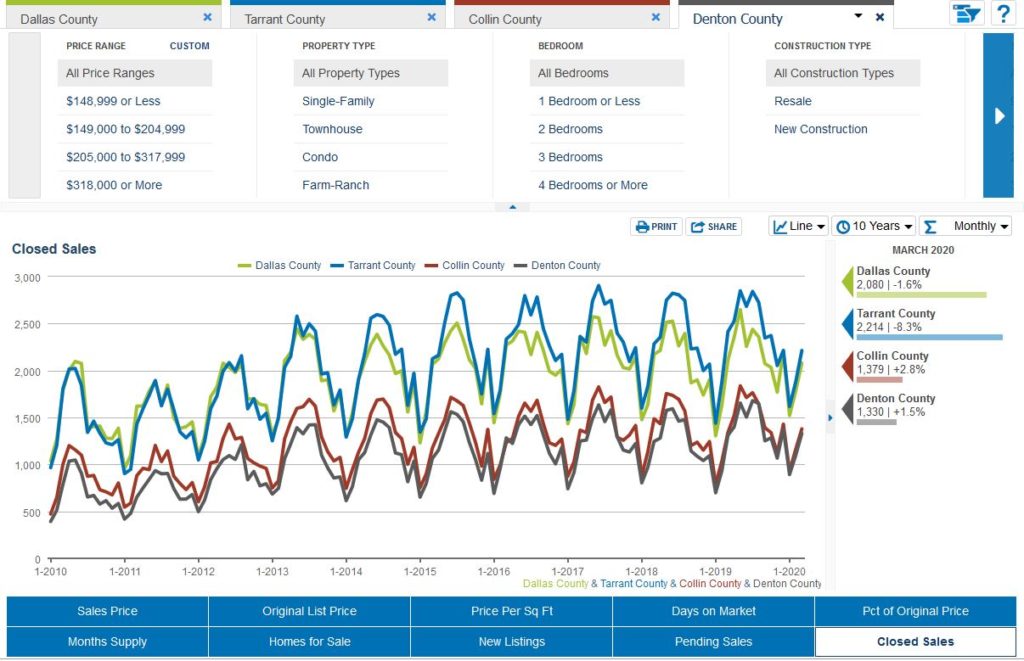
Just for context, here is how the numbers look on a 10-year scale.
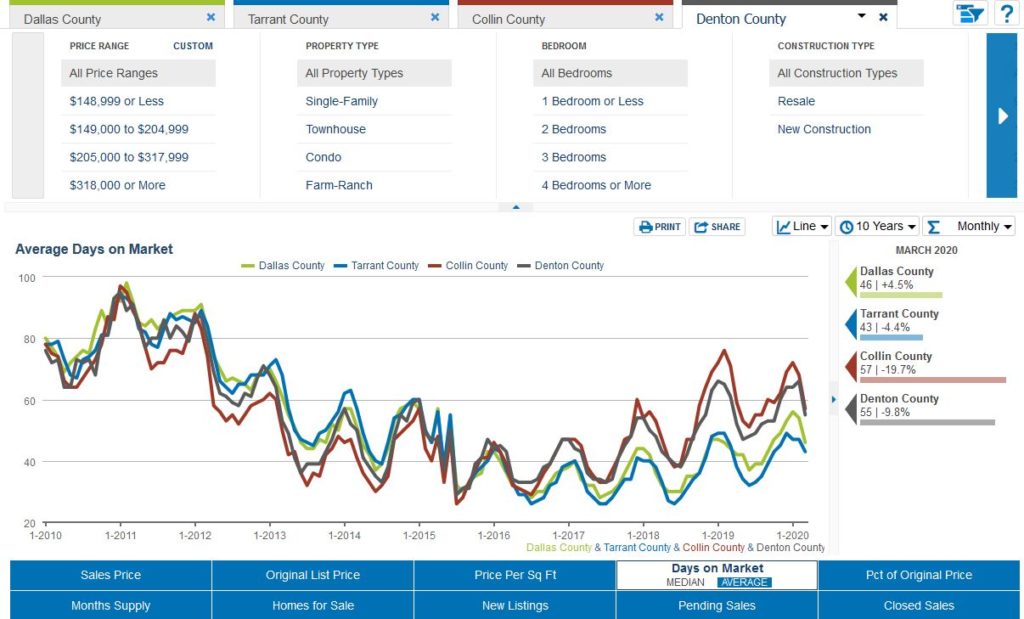
The average Days On Market (DOM) for single-family homes (existing construction)
January 2019- March 2020
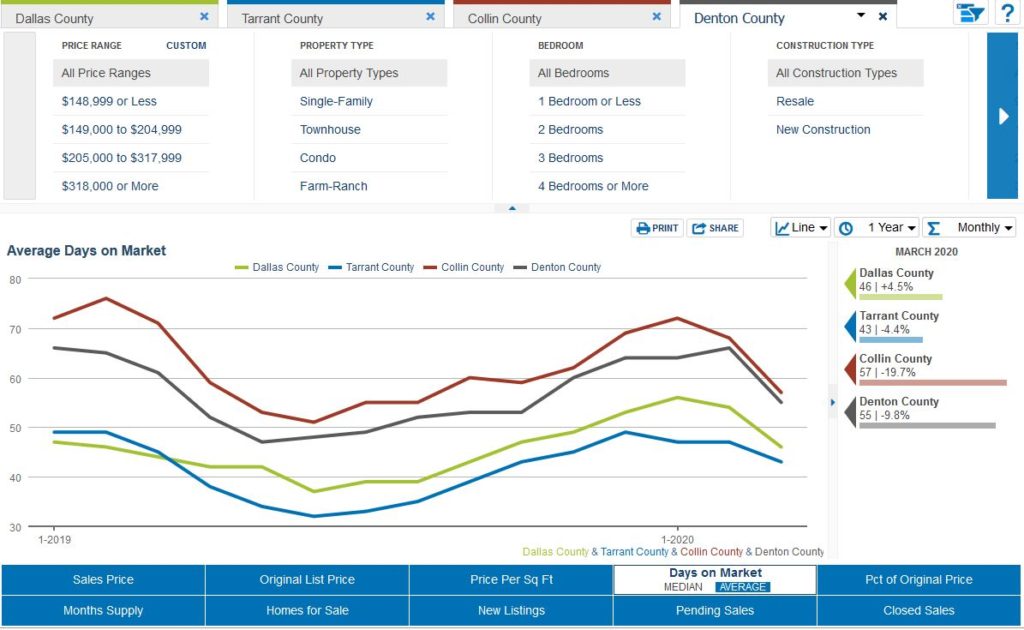
The average DOM was less in March 2020 than in March 2019, especially in Collin county.
Just for context, here is how the numbers look on a 10-year scale.
Average home prices for single-family homes (existing construction)
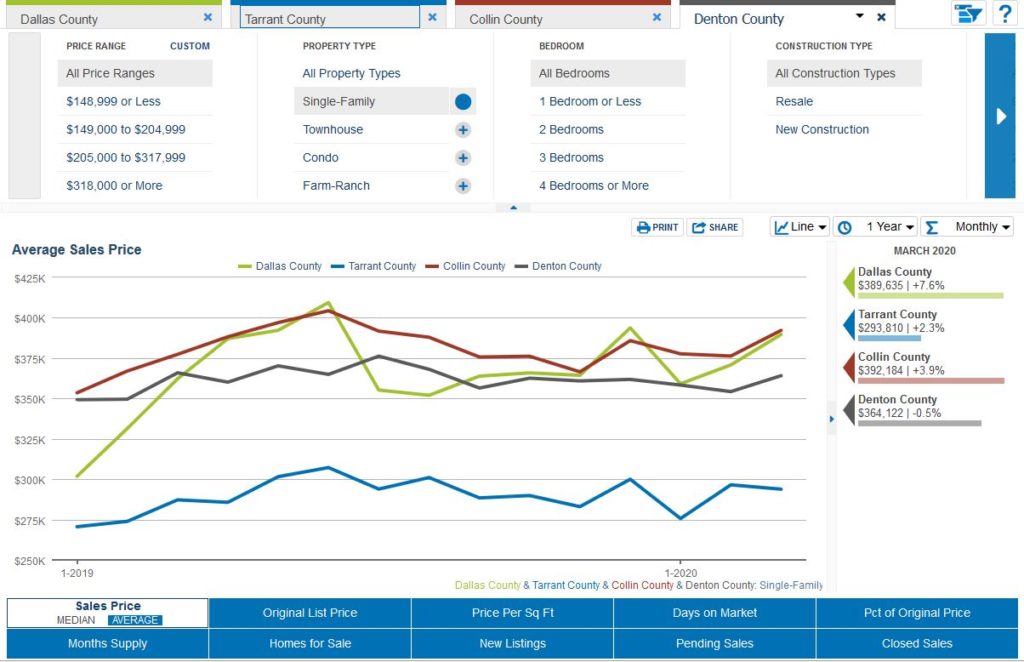
The average home price was up slightly in Dallas, Collin, and Tarrant counties, and slightly down in Denton county as compared to March 2019. I am sure that the April 2020 numbers will be more reflective of the COVID situation, but for March averages, this is what we have.
Just for context, here is how the numbers look on a 10-year scale.
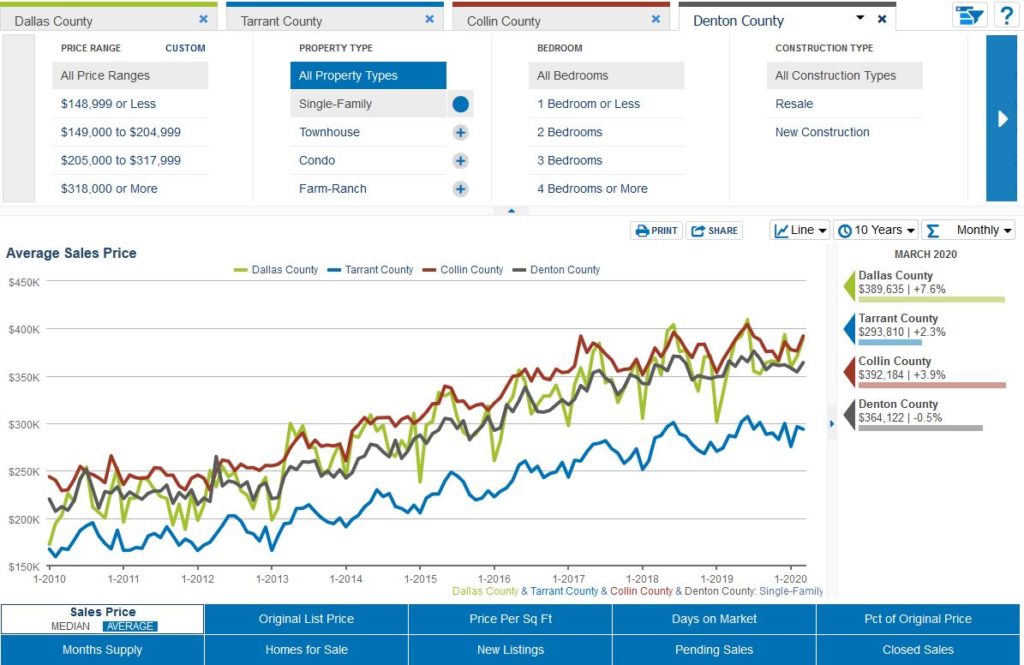
Overall, however, the average home price has nearly doubled as compared to 2010.
All data was provided by NTREIS, the North Texas MLS, and all graphs are theirs.