

Analysis of the North Texas Home Market Performance in 2023
December 24, 2023
by Elena Garrett, December 22, 2023
Home Prices Fluctuations Throughout 2023
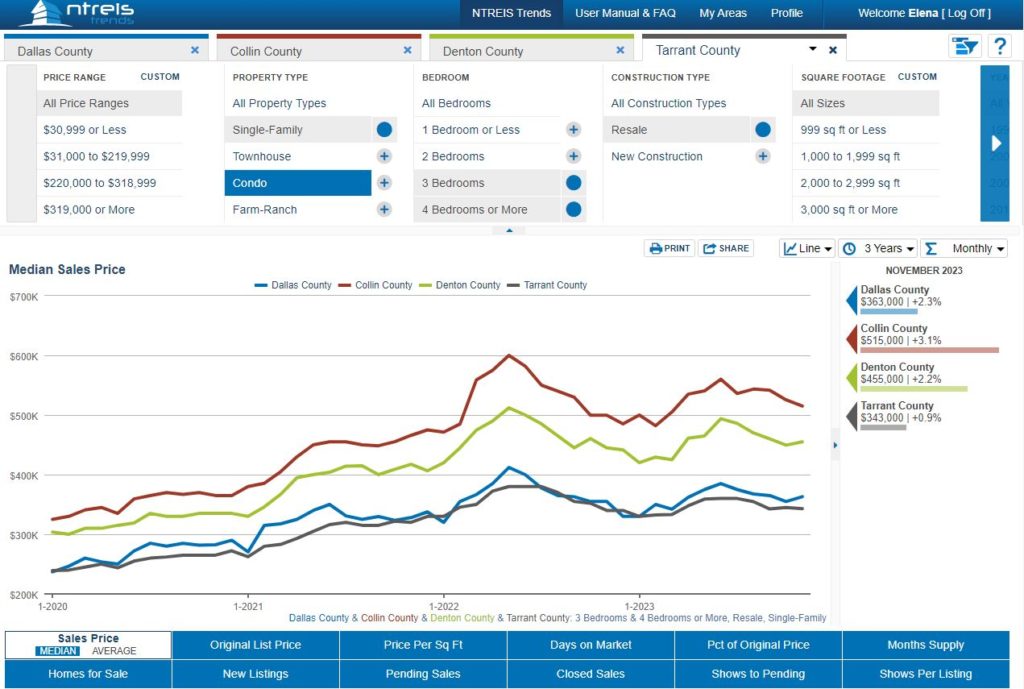
The Dallas-Fort Worth (DFW) area’s real estate market in 2023 has been a testament to resilience and growth in the face of nationwide economic headwinds. Here’s a closer look at how the housing prices in the DFW counties have performed throughout the year.
Dallas County started the year with a median sale price of $330,000, climbing to a peak of $385,000 by June before receding slightly to $363,000 by November. This reflects a robust market that has managed to maintain its momentum despite broader market uncertainties.
Collin County showcased impressive growth, with the year opening at a median price of $500,000 and reaching a high of $560,000 mid-year. Even with a slight retraction, the November figures held strong at $515,000, indicating sustained buyer interest and a competitive market landscape.
In Denton County, the median sales price ascended from $420,000 in January to $493,750 by June. A minor pullback followed, settling at $455,000 by November, yet still demonstrating a healthy year-over-year growth.
Tarrant County mirrored the region’s steady performance. Prices nudged upwards from $330,000 at the beginning of the year to $360,000 in the summer, and concluded at a steady $343,000 in November, suggesting a stabilizing market as the year ends.
The DFW area’s real estate market has been bolstered by a thriving job market, significant population growth, and robust construction activities, which have collectively contributed to a ‘hot’ market, despite the forecasted cooling in other regions.
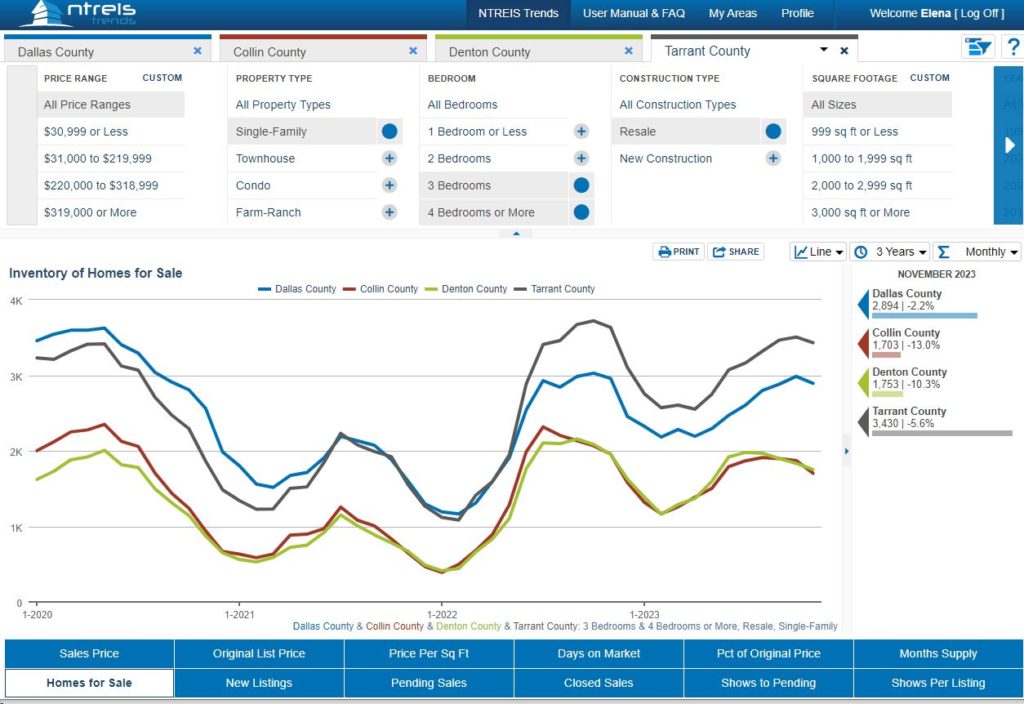
Homes for Sale Availability in the DFW Area in 2023
Following a typical annual pattern, the number of homes available for sale was at its lowest levels in January of 2023 and gradually increased, peaking in the summer months.
- Dallas County saw a noticeable increase from 2,325 homes in January to a peak of 2,883 in September.
- Collin County also increased from 1,319 homes in January to its highest at 1,910 in August.
- Denton County and Tarrant County followed similar patterns, peaking in July and October, respectively.
Analyzing the combined data of median sales prices and home inventory for the Dallas-Fort Worth area in 2023, the following months provide a good balance of availability AND moderate prices:
- February and March saw increased inventory levels from January but had not yet reached the peak prices of the mid-year. This suggests a good balance for buyers in terms of both availability and avoiding the highest prices.
- July and August showed a slight decline in median prices from the peak in June while still maintaining relatively high inventory levels, indicating another potential window for buyers to find a good balance.
- October and November also stand out as months where median prices decreased from the highs of mid-year and inventory remained plentiful, potentially offering better deals for homebuyers.
Given these trends, price-conscious buyers looking for a balance between availability and price might consider February, March, July, August, October, and November as optimal months to purchase homes in the DFW area.
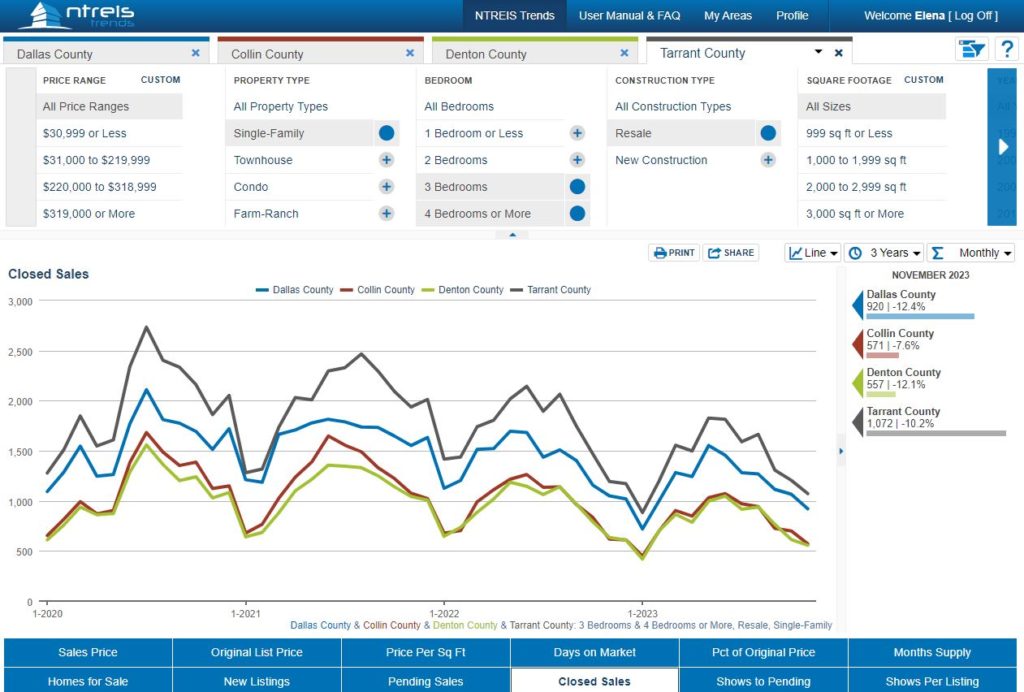
Demand for Homes in the DFW Area in 2023
The demand for homes in the Dallas-Fort Worth area, as expressed by closed sales for 2023, showed noticeable fluctuations throughout the year across all counties. Here is a brief analysis:
- Highest Levels of Demand:
- Dallas County saw the highest demand in May with 1,553 closed sales.
- Collin County experienced its peak also in May, with 1,032 closed sales.
- Denton County had the most demand in June, with 1,048 closed sales.
- Tarrant County recorded the highest in May, with 1,827 closed sales.
- Lowest Levels of Demand:
- Dallas County had its lowest demand in January, with 719 closed sales.
- Collin County‘s demand was lowest in January, with 448 closed sales.
- Denton County saw the least demand in January, with 419 closed sales.
- Tarrant County also had the lowest demand in January, with 883 closed sales.
For home sellers in the Dallas-Fort Worth area looking to find a month in 2023 that provides a good balance of low competition but higher prices, the analysis of closed sales and median sales prices together suggests the following:
- March stands out as a notable month across most counties. In Dallas County, for example, there was a significant number of closed sales (1,282) with a relatively high median price of $342,000, and an inventory of 2,283 homes. This trend is similar in Collin, Denton, and Tarrant counties, indicating strong sales activity with relatively high prices and a decent inventory level.
- May was another strong month, especially in Collin County, with a high median price of $540,500 and a considerable number of closed sales (1,032), against an inventory of 1,502 homes. Dallas, Denton, and Tarrant counties also showed similar trends with high median prices and significant sales activity.
- July and August showed a good balance of high median prices and a significant number of closed sales in all counties. Although inventory was on the higher side, indicating more competition, the number of sales and the prices achieved were still favorable for sellers.
Overall, for home sellers in the DFW area, March, May, July, and August of 2023 were the best months that provided a favorable balance of high prices, substantial sales, and manageable competition.
Number of Home Shoppers and Length of Time on the Market the DFW Area in 2023
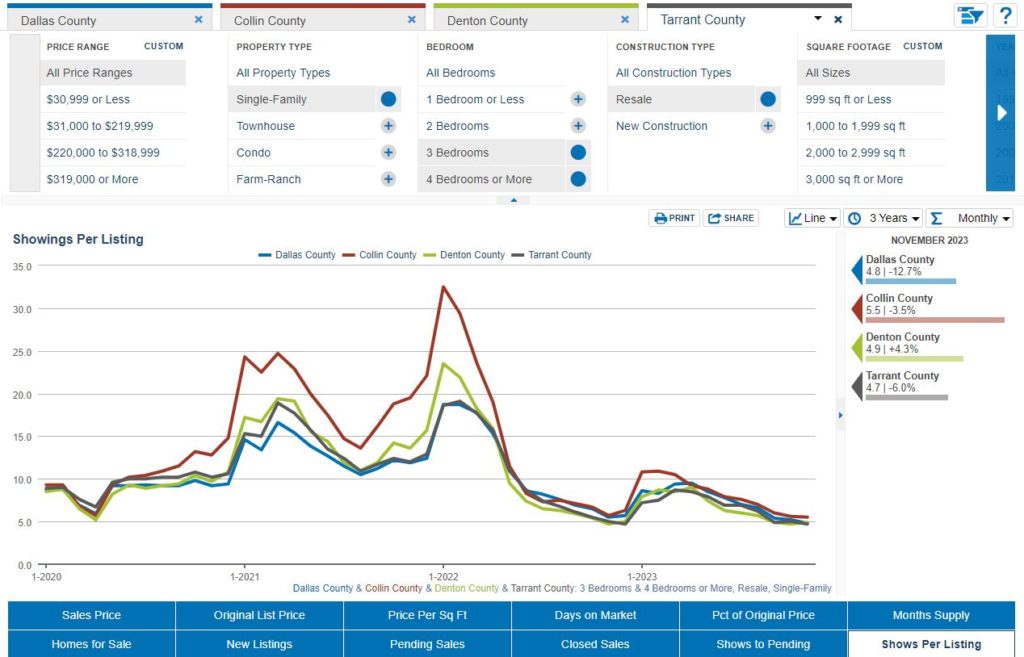
The analysis of buyer activity in the Dallas-Fort Worth area for 2023, focusing on the number of home shoppers per house (showings per listing) and median days on the market, reveals the following:
- Peaks of Shopper Activity:
- March and April experienced the highest levels of shopper activity, as evidenced by increased showings per listing across all counties. For instance, Dallas County recorded 9.4 showings per listing in March and 9.5 in April.
- These months also corresponded with the shortest median days on the market, suggesting that homes were selling faster due to higher buyer interest.
- Lows of Shopper Activity:
- January and February saw lower levels of shopper activity, with fewer showings per listing, such as 8.6 in Dallas County in January.
- These months had longer median days on the market, indicating that homes were taking longer to sell.
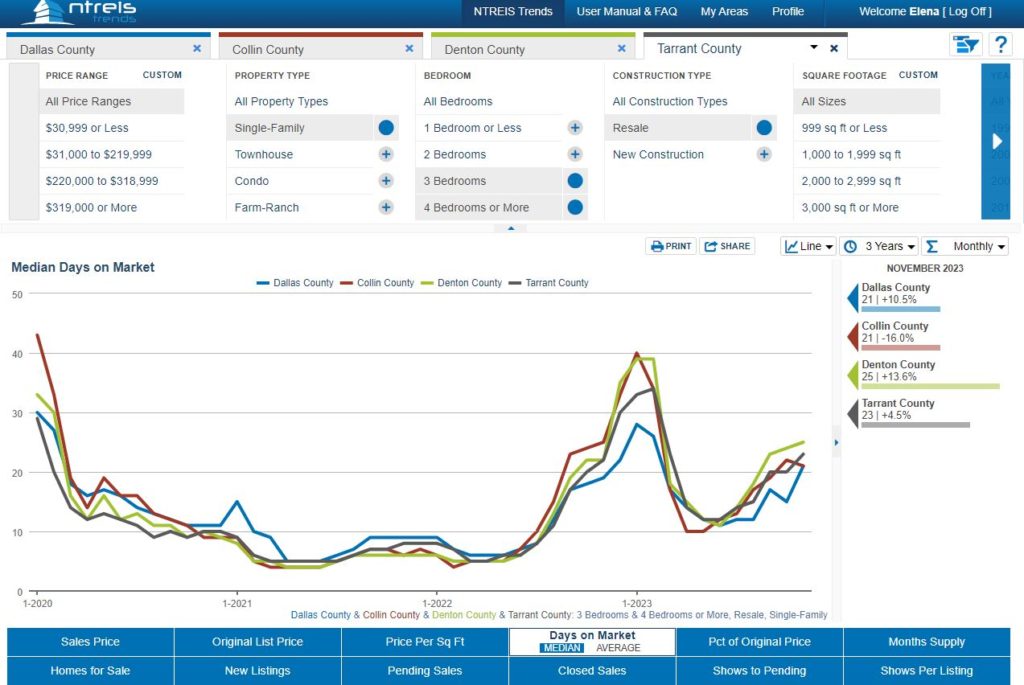
Analyzing the Dallas-Fort Worth area’s real estate market in 2023 by looking at the relationship between the sale price and the number of days the house waited to sell, the optimal time for sellers in terms of achieving the highest prices with the shortest days on the market can be identified as follows:
- April and May were the standout months across most counties. For instance, in Dallas County, the median sales price in April was $362,000 with homes staying on the market for an average of 14 days. In May, this trend continued with a higher median price of $375,000 and homes staying on the market for only 12 days.
- Collin County saw its peak in May, with a median sales price of $540,500 and homes staying on the market for just 10 days.
- Denton and Tarrant Counties followed similar patterns, with both counties reaching their lowest median days on the market in May, coupled with high median sales prices.
For sellers seeking to maximize their sale price while minimizing the time their property stays on the market, April and May of 2023 were the most favorable months to list their homes in the DFW area.
Conclusions for Home Buyers Based on the Data from 2023
For home buyers in the Dallas-Fort Worth area in 2023, the analysis of median sales prices and the number of showings per listing (an indicator of buyer competition) suggests the following months as optimal for finding lower prices with less competition:
- January 2023 was favorable across most counties. In Dallas and Tarrant Counties, the median sales price was $330,000 with fewer showings per listing (8.6 in Dallas and 7.2 in Tarrant), indicating lower competition. Collin and Denton Counties also saw relatively lower prices and fewer showings per listing.
- February 2023 continued the trend of lower prices and fewer showings in most counties, making it another good month for buyers, especially in Collin County with a median price of $482,000 and 10.9 showings per listing.
- March 2023 saw a slight increase in prices but still maintained fewer showings per listing compared to the peak months, suggesting continued lower competition in the market.
- October 2023 had a higher median sales price but significantly fewer showings per listing in all counties, indicating reduced competition despite the slightly higher prices.
For home buyers seeking the lowest prices with the least amount of competition from other buyers, January, February, March, and October of 2023 were the most favorable months in the DFW area.

Conclusions for Home Sellers Based on the Data from 2023
After combining and analyzing the provided data for 2023, including closed sales, inventory, median days on the market, median sales prices, and showings per listing, here are recommendations for the best times for home sellers in the Dallas-Fort Worth area:
- April and May: These months consistently showed high closed sales figures across all counties, indicating a higher probability of closing. Additionally, median sales prices were among the highest in these months, especially in Collin and Denton Counties. Days on the market were relatively shorter during this period, suggesting a quicker selling process.
- June and July: Following the spring peak, these summer months also presented strong selling conditions. While the number of showings per listing started to decrease, indicating less competition, the closed sales remained high, and median sales prices were still elevated compared to the start of the year.
- October: Interestingly, October showed a resurgence in buyer interest with an increase in showings per listing and a stable number of closed sales, coupled with relatively high median sales prices. Days on the market began to increase, but the conditions were still favorable for sellers.
In summary, for sellers aiming for the shortest days on the market, the highest probability of closing, and the highest sale price, April, May, June, July, and October of 2023 were the most advantageous months in the DFW area.