
DFW Rental Profitability – Table of Zip Codes December 2025
December 24, 2025
By Elena Garrett, Dec 2025
One of the biggest challenges I see with first-time and newer real estate buy-and-hold investors isn’t lack of enthusiasm or motivation—it’s lack of clear “no” criteria in their search for homes. Most people start their search by scrolling listings that look good, like clean photos, decent-sounding price, wouldn’t mind owning this” feeling…
But after reviewing a few dozens of such “wouldn’t mind owning this” homes, frustration starts to sets in.
Is this actually a good deal—or just a nice house? How do I know? What is I make a mistake? How to chose which one of those nice homes is the ONE?
The true problem is, unless your eye is trained to look for what MATTERS in a house, almost every property looks promising on the surface. And what matters is… will the potential property cashlow? And how do we know without spending too much time on the research for each property?
A Simple Starting Guardrail: The 1% Rule
Investors with different levels of experience and sophistication use different metrics. For first-time investors who are literally overwhelmed by the choices, I usually recommend starting with a very simple screening rule: the 1% rule.
Here’s the quick version:
- Take the monthly rent, multiply it by 100, then compare that number to the purchase price
The closer the rents to 1% of the price, the closer the deal to cash-flow viability—although additional facts such as taxes, maintenance, and competition from other rentals would ideally be also investigated.
- Example: monthly rent is 2,000, sale price is $450,000. $2,000×100=$200,000,which is no where close to $450,000, therefore there is literally almost no way for this property to be a “good deal.”
Is it perfect? No (it actually does not account for many important things).
Is it conservative? Yes.
Is it helpful for beginners? Well, it is better than no estimate at all, and it could be a start of a deeper analysis
The Monthly Table That Does the Heavy Lifting
I hope it will not come as a shock that not all areas and not all zip codes in North Texas have the same cashflow potential. And often, the zip codes that have the best cashflow potential are not the ones people guess first!
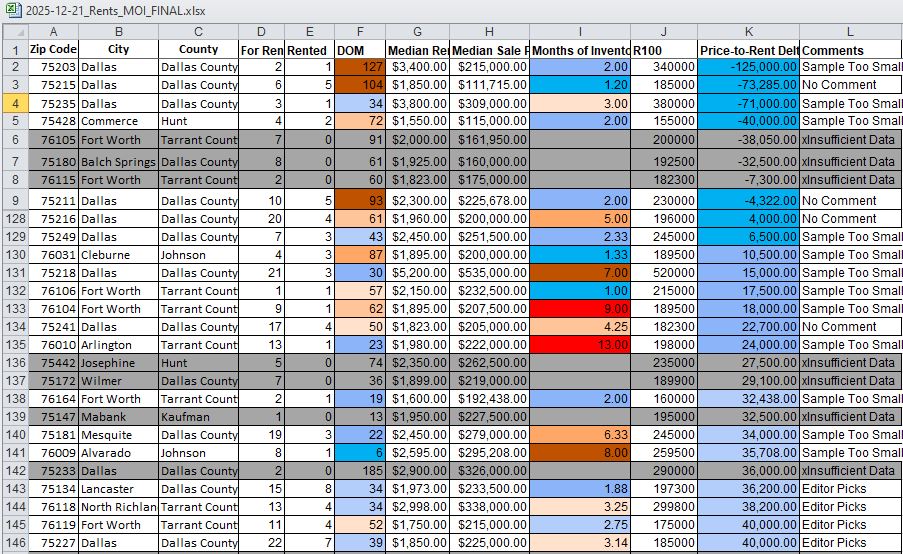
To help the investors to quickly identify the zip codes that , I publish a monthly DFW Investor ZIP Code Table designed to do the early filtering for you.
Each month, the table:
- Estimates median rents by ZIP code
- Applies a 1% rule proxy (rent × 100)
- Compares that number to median sale prices
- Adds average Days on Market (DOM)
- Adds Months of Inventory (MOI)
- Flags a small number of Editor Specials
The result?
👉 The entire DFW area gets narrowed down to roughly a dozen color-coded ZIP codes where it’s easier to find workable deals by simply looking at the color of the zip code (ex. blue is good, yellow or orange – not so much).
In ZIP codes that don’t show up well in the table, deals usually still exist—but they tend to require more patience, more rehab, or more creativity.
Want the Full December Table?
I don’t publish the full table publicly—it changes monthly and is meant for active investors.
If you want a copy of the December DFW Investor ZIP Code Table,
📞 Call or text me at 469-371-4961
I’ll send you the full table and explain how to use it based on whether you’re:
- A first-time investor
- A buy-and-hold landlord
- Or someone refining an existing portfolio
Additional Articles For Buy-And-Hold Investors
When a “Discounted” off-Market Rental Turns Into a Perfect Sh*t Storm
Off-Market Deals for Finding Cash-Flowing Rentals: Pros and Cons
Find Your Next DFW Rental Faster With This Simple Table
The Emotional Hangover From the COVID Economy — And What it Means for Real Estate Decisions in 2026
DFW Rental Profitability – Table of Zip Codes December 2025